This 2026 guide walks you through connecting AWS IoT Analytics, covering device setup, data ingestion, pipeline orchestration, and analytics-ready datasets for faster, governed IoT insights.
Home » Data Analytics

This 2026 guide walks you through connecting AWS IoT Analytics, covering device setup, data ingestion, pipeline orchestration, and analytics-ready datasets for faster, governed IoT insights.
This guide breaks down data quality issues, how to identify them, and step-by-step solutions for fixing them. Explore best practices to prevent data errors, tools for data quality management, and real-world case studies.
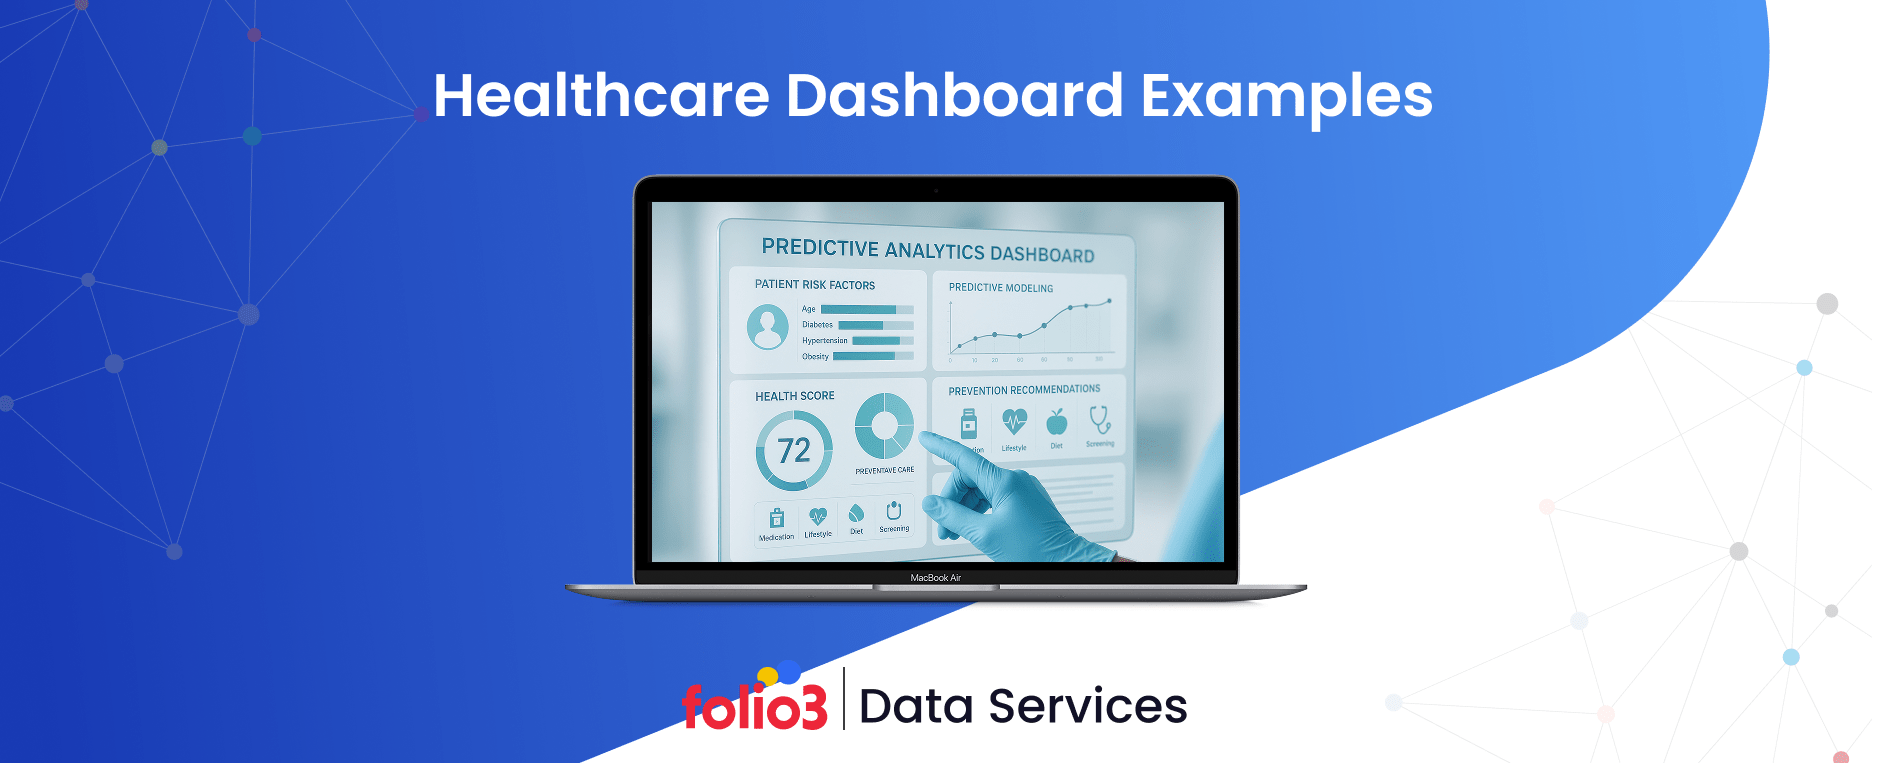
This guide explains healthcare dashboards, highlighting their types, examples, benefits, and KPIs. Explore who benefits most, how to choose the best dashboard, and success stories from real-world implementations.
This comprehensive guide explains agricultural supply chain visualization, highlighting benefits, key data sources, visualization techniques, AI-driven analytics, best practices, and examples of successful implementations.
Understand Big Data vs Data Warehouse with a detailed comparison of features, use cases, and integration methods. Learn how businesses leverage both for analytics, decision-making, and scalable data processing.
Learn why big data is difficult to manage at scale and discover strategies to overcome common challenges like data quality, cost, performance, and governance. Explore best practices and tools like Hadoop, Spark, and Snowflake.
Explore data analytics statistics for 2026, from global market growth and business adoption to ROI, career shifts, consumer analytics, and future industry trends.
Understand customer churn prediction and its impact on business growth. Learn how prediction models work, the data required, industry use cases, tools, challenges, and best practices to improve customer retention.
This guide covers top big data trends, adoption patterns, benefits, and challenges across industries, helping businesses prepare for a future driven by data insights and analytics innovation.
This guide explains predictive analytics in finance, highlighting its applications, benefits, challenges, tools, and best practices, along with real-world case studies and strategies for maximizing ROI.