
Healthcare dashboards have become the digital nerve center of modern hospitals, transforming overwhelming volumes of clinical, financial, and operational data into actionable insights. These tools bridge the gap between fragmented systems, providing real-time visibility that helps organizations improve patient outcomes and operational performance.
The challenge is clear that the electronic health records generate terabytes of data every day, revenue cycle systems track millions of transactions, and operational metrics span dozens of departments. Without effective visualization, this data remains siloed making it nearly impossible to respond quickly to patient needs or financial pressures.
Traditional reporting methods, with their static weekly or monthly updates, fail to capture critical trends in time. In contrast, real-time healthcare dashboards deliver continuous data updates, role-based access, and intuitive visualizations that support faster, evidence-based decisions.
From patient dashboards that track vitals in real time to healthcare analytics dashboards that monitor costs and resources, these solutions empower leaders across all levels of care delivery. The following guide explores practical healthcare dashboard examples that illustrate how hospitals can transform data into smarter decisions in improving clinical outcomes, optimizing operations, and ensuring financial sustainability.
What Are Healthcare Dashboards?
Healthcare dashboards are dynamic visual platforms that present critical performance metrics, key indicators, and real-time data flows necessary for managing hospital functions. These systems consolidate information from various sources such as electronic health records (EHRs), billing systems, inventory management networks, and operational software into cohesive, up-to-the-minute displays that enable more informed decision-making throughout every tier of a healthcare institution.
What’s the Technology Behind Healthcare Dashboards?
The technology powering these dashboards varies by use case and organizational requirements. Most modern solutions use business intelligence in healthcare platforms, cloud-based analytics, or custom-built applications that connect to existing hospital systems through APIs and data integration protocols. This smooth connectivity ensures reliable access to up-to-date data without disrupting established workflows.
How Healthcare Dashboards Differ from Reporting Tools?
Unlike traditional static reporting tools, healthcare analytics dashboards offer real-time, interactive capabilities. Users can drill down into specific metrics, filter data by criteria such as department or timeframe, and receive automated alerts when thresholds are crossed.
By combining these functions with modern data visualization tools, dashboards transform complex hospital information into clear, actionable insights that shift healthcare management from reactive to data-driven and preventive.
Characteristics of Effective Healthcare Dashboards
When designed effectively, dashboards evolve into indispensable medical dashboard tools, supporting patient care, financial performance, and operational efficiency. So, the best healthcare dashboard share several defining features:
- Clarity & simplicity: Presenting insights without overwhelming users.
- Real-time updates: Ensuring data reflects current hospital conditions.
- Role-based access: Protecting sensitive patient and financial information.
- Workflow integration: Fitting naturally into daily routines for clinicians, administrators, and executives.
5 Different Types of Healthcare Dashboards
Healthcare organizations utilize various dashboard types, each designed to serve specific audiences and purposes within the hospital ecosystem. Understanding these categories helps organizations select the right tools for their particular needs and user communities.
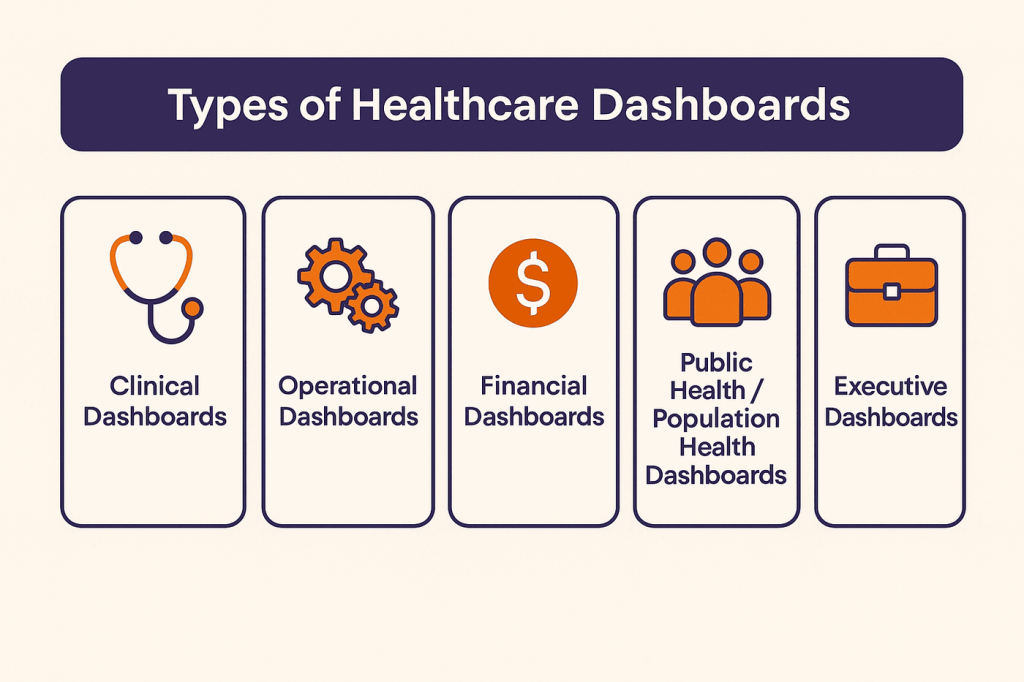
1. Clinical Dashboards
Clinical dashboards focus on patient care metrics and clinical outcomes that directly impact quality of care. These tools typically display patient vitals, medication schedules, lab results, treatment progress, and safety indicators through advanced data visualization techniques.
Healthcare analytics dashboards in this category often include infection control metrics, readmission rates, and clinical quality measures that help healthcare teams deliver evidence-based care.
Nurses use clinical dashboards to monitor multiple patients simultaneously, identifying those requiring immediate attention based on vital sign trends or medication schedules. Physicians access these tools to review patient progress, coordinate care team activities, and make treatment decisions based on comprehensive data views rather than fragmented information sources.
2. Operational Dashboards
Operational dashboards oversee the daily operations of hospital units and infrastructure. These systems monitor bed availability, emergency room waiting periods, workforce distribution, equipment deployment, and resource management data.
Medical facility dashboards in this classification may display patient movement trends, discharge coordination status, and capacity oversight metrics.
Hospital leadership depends on operational dashboards to detect inefficiencies, enhance resource distribution, and maintain seamless patient progression across the organization. These platforms facilitate the prediction of capacity limitations before they reach critical levels, allowing for anticipatory management of patient positioning and resource assignment.
3. Financial Dashboards
Financial dashboards focus on revenue cycle management, cost control, and profitability metrics that ensure organizational sustainability. These tools typically display billing performance, collection rates, claim denial patterns, cost per case, and budget variance analysis. Revenue cycle dashboard examples show key metrics like days in accounts receivable, clean claim rates, and payer mix analysis.
By leveraging a comprehensive data analytics framework, CFOs and revenue cycle managers can systematically analyze these metrics to identify trends, optimize billing processes, and make informed financial decisions.
Chief financial officers and revenue cycle managers use these dashboards to identify financial performance trends, monitor collection activities, and optimize billing processes. The real-time nature of these tools enables quick responses to payment delays or billing issues that could impact cash flow.
4. Public Health / Population Health Dashboards
Population health dashboards aggregate data across patient populations to identify trends, risk factors, and opportunities for preventive care interventions. These tools often apply advanced data transformation techniques to combine demographic patterns, disease prevalence, social determinants of health, and community health indicators into a unified view that informs public health strategies.
Healthcare systems use population health dashboards to manage chronic disease programs, identify high-risk patient populations, and coordinate community health initiatives. These tools support value-based care models by tracking outcomes across patient populations rather than individual encounters.
5. Executive Dashboards
Executive dashboards provide high-level organizational performance metrics that support strategic decision-making. Some healthcare systems are beginning to explore generative AI implementation within these dashboards to automatically summarize complex data sets, create draft reports, and highlight patterns that might otherwise be overlooked.
These tools consolidate financial, operational, and clinical performance indicators into comprehensive views that enable leaders to assess overall organizational health and identify areas requiring strategic attention.
C-suite executives use these dashboards to monitor key performance indicators, track progress toward strategic goals, and identify emerging trends that require organizational responses. The information presented at this level typically aggregates departmental metrics into organizational scorecards that support board reporting and strategic planning activities.
What Do Practical Healthcare Dashboard Examples Look Like?
Real-world healthcare dashboard implementations demonstrate how healthcare organizations successfully deploy dashboard technology to address specific operational challenges and improve patient care outcomes.
Example 1: Patient Care Dashboard
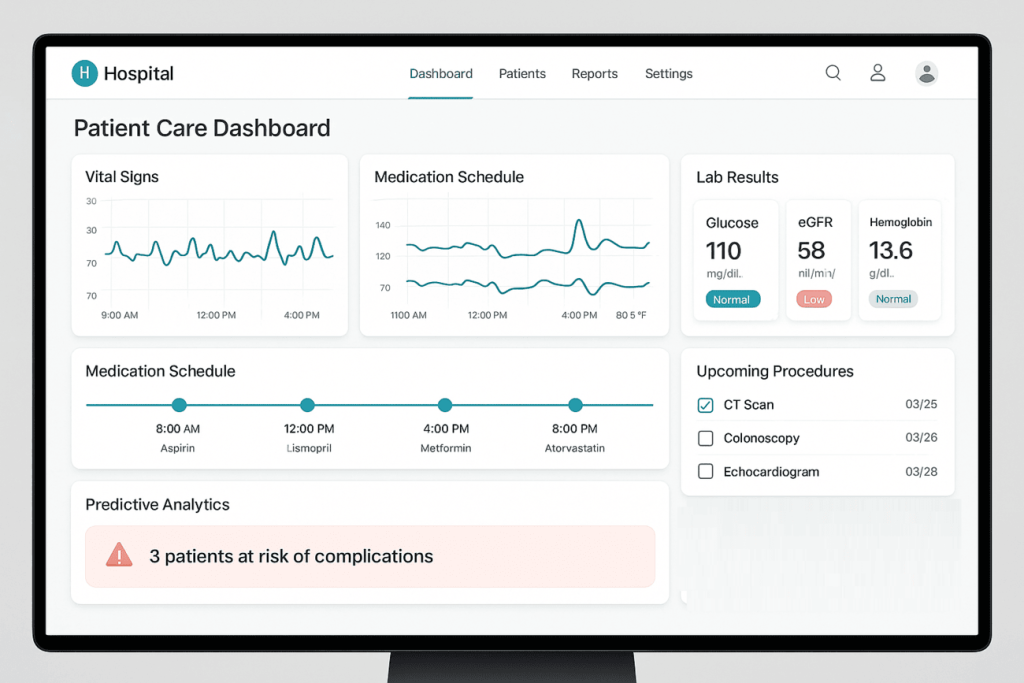
Patient care dashboards provide comprehensive views of individual patient status and care team activities. These medical dashboard implementations typically display current vital signs, medication schedules, upcoming procedures, lab results, and care plan progress. Alert systems notify healthcare teams when patient conditions change or critical tasks require attention.
Key metrics include patient acuity scores, pain levels, medication administration records, and care milestone completion rates.
Advanced implementations incorporate predictive analytics healthcare solutions that identify patients at risk for complications based on historical patterns and current condition indicators.
Example 2: Emergency Department Dashboard
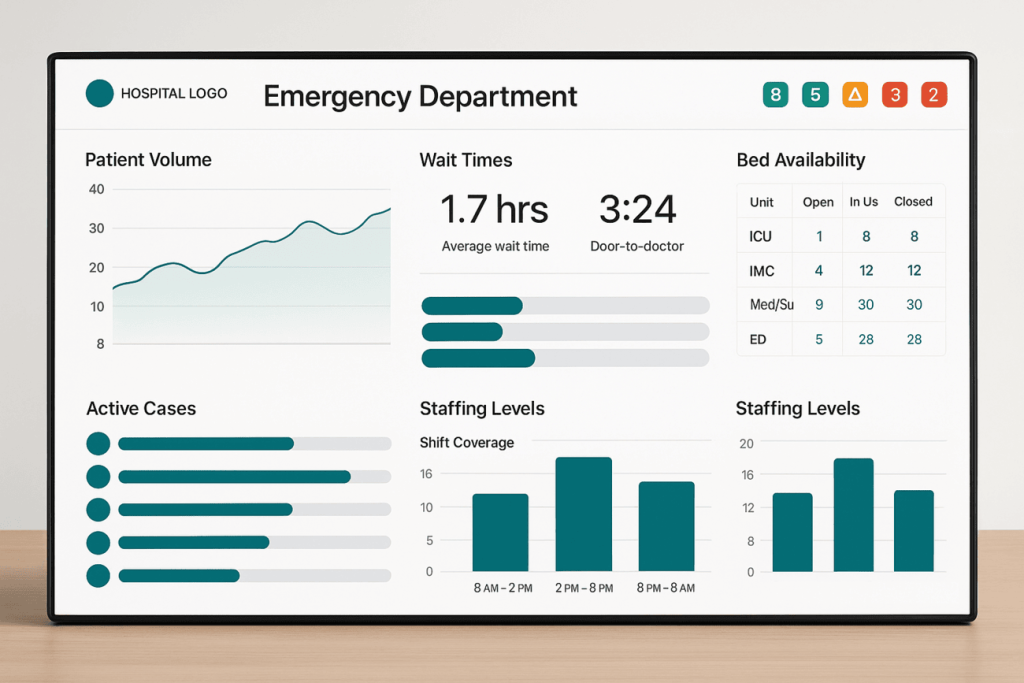
Emergency department dashboards enhance patient movement and resource management in high-pressure environments. These platforms present real-time patient counts, waiting periods, bed status, personnel availability, and care progression for all ongoing cases. Triage coordinators and shift supervisors utilize these systems to distribute workloads effectively and pinpoint patients needing urgent care.
Operational indicators monitored include patient arrival-to-consultation intervals, average visit durations, patient feedback ratings, and processing efficiency rates. Immediate data refreshes allow swift responses to overcrowding issues and workforce gaps that frequently arise in emergency care contexts.
Example 3: Hospital Bed Management Dashboard
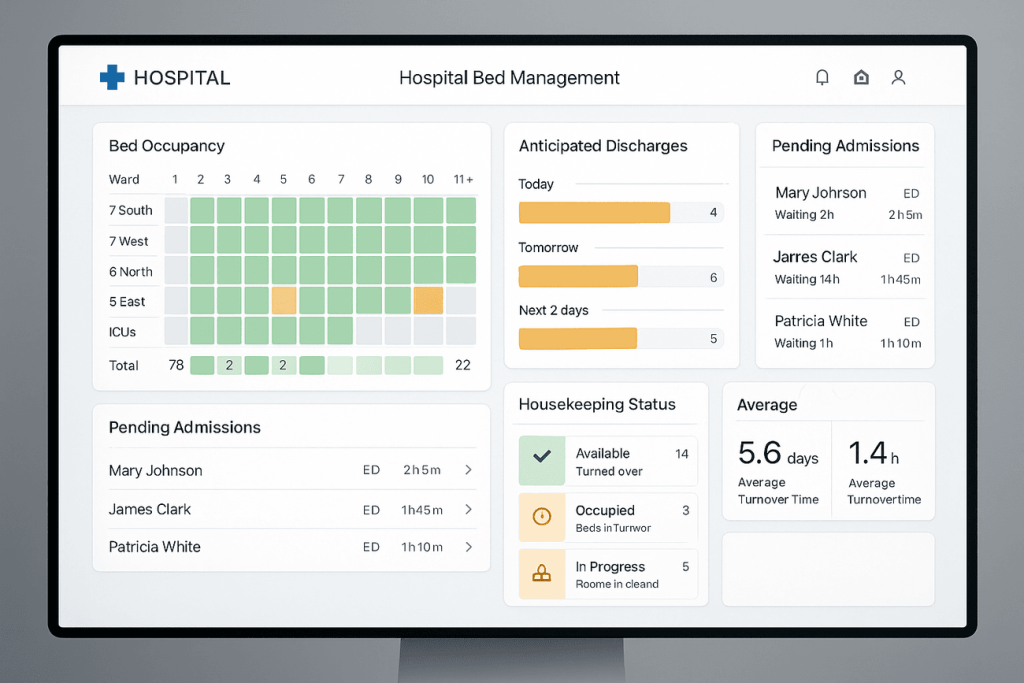
Bed management dashboards coordinate patient placement and discharge planning activities across hospital units. These tools show current bed occupancy, anticipated discharges, pending admissions, and housekeeping status for each unit. Bed management teams use this information to optimize patient placement and reduce wait times for admission.
Critical metrics include occupancy percentages, average length of stay, discharge planning progress, and bed turnover times. Integration with electronic health records enables automatic updates when patient status changes or discharge orders are entered.
Example 4: Revenue Cycle Dashboard
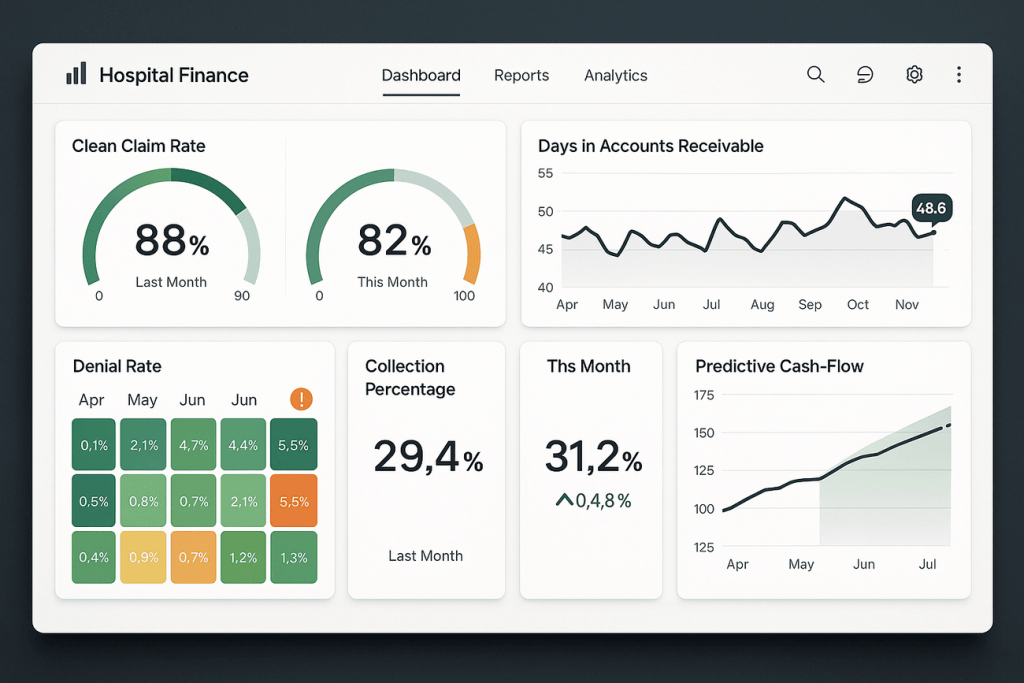
Revenue cycle dashboards monitor financial performance across the entire patient care continuum. These revenue cycle dashboard examples display key metrics like clean claim rates, days in accounts receivable, denial rates, and collection percentages. Financial analysts use these tools to identify bottlenecks in the billing process and optimize revenue capture.
Integrating an AI enterprise search solution can further enhance these dashboards by allowing staff to quickly locate relevant billing records, payer policies, or historical claim data, improving the speed and accuracy of financial analysis.
Advanced implementations include predictive analytics that forecast cash flow based on current billing activities and historical collection patterns. Real-time alerts notify staff when claims require immediate attention or when payer patterns change significantly.
Example 5: Population Health Dashboard
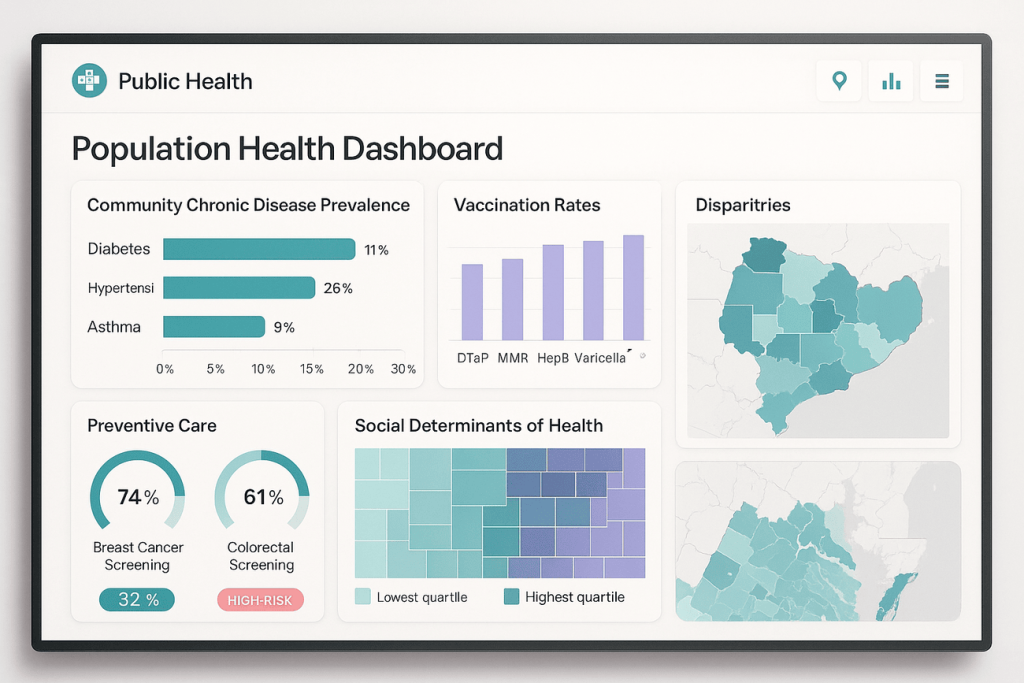
Population health dashboards consolidate patient information to detect community wellness patterns and vulnerability indicators. These platforms examine chronic condition frequencies, immunization coverage, socioeconomic health determinants, and treatment deficiency recognition throughout patient cohorts. Healthcare coordinators and wellness administrators leverage these insights to develop focused interventions and prophylactic health initiatives.
Critical success measures encompass hospital return rates, prescription compliance levels, preventive screening fulfillment percentages, and risk classification indicators. Spatial visualization features assist in recognizing regional health inequities and resource distribution requirements.
Example 6: Telehealth Dashboard
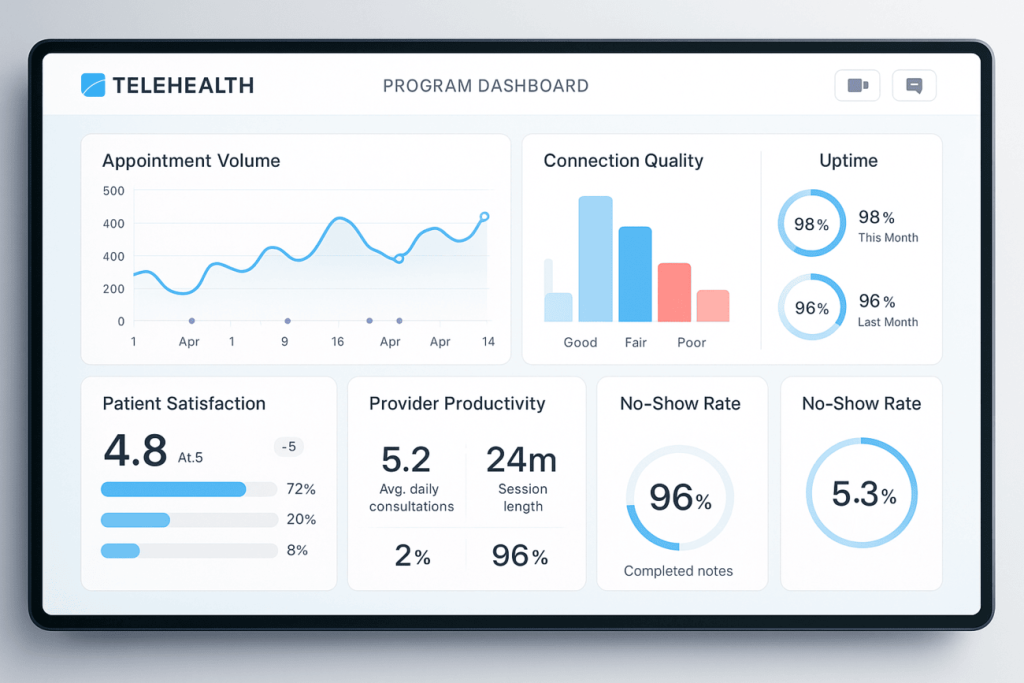
Telehealth dashboards monitor virtual care delivery and patient engagement across remote care programs. These tools track appointment volumes, technical performance metrics, patient satisfaction scores, and clinical outcomes for telehealth encounters using real-time data collection methods. Healthcare providers use these dashboards to optimize virtual care delivery and identify opportunities for program expansion.
Performance metrics include connection quality indicators, appointment completion rates, patient no-show percentages, and provider productivity measures. Integration with electronic health records ensures continuity between virtual and in-person care episodes.
Key Advantages of Using Healthcare Dashboards
Healthcare dashboard examples reveal measurable improvements in patient care, financial performance, and operational efficiency when organizations implement robust, real-time analytics tools. Some benefits include:
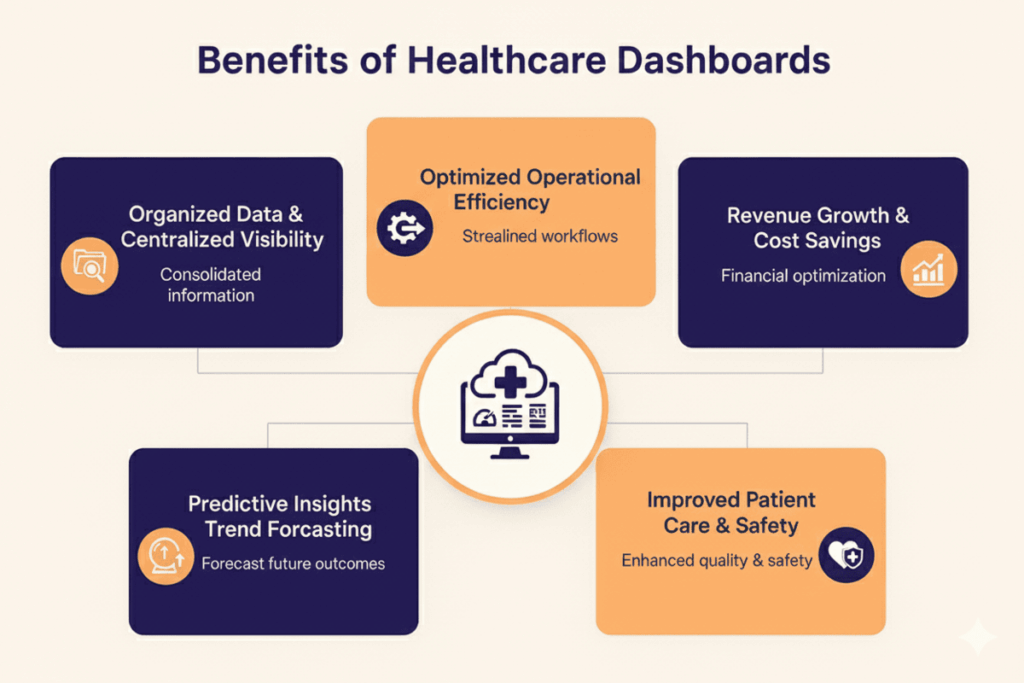
1. Organized Data & Centralized Visibility
Dashboards eliminate data silos by consolidating financial, clinical, and operational metrics into a single interface. Instead of toggling across fragmented systems, staff gain unified visibility. A recent survey found that clinicians save up to 30% of their time when key data is centralized, offering data analytics stats that highlight how centralization enables faster, more confident decisions.
2. Optimized Operational Efficiency
Healthcare analytics dashboard examples show how hospitals reduce wait times, optimize staffing, and improve patient flow through real-time monitoring. Automated alerts flag issues before they escalate, helping facilities achieve 20–25% improvements in resource utilization and smoother care delivery.
3. Revenue Growth & Cost Savings
Healthcare dashboard examples highlight how real-time visibility boosts claim accuracy and reduces delays. Organizations using financial dashboards report faster reimbursement cycles and improved cost tracking, strengthening profitability while controlling expenses.
4. Predictive Insights & Trend Forecasting
Dashboards equipped with predictive analytics techniques anticipate demand for services, staffing needs, and financial outcomes. This proactive approach empowers leaders to allocate resources effectively and prevent issues before they arise by transforming dashboards into strategic decision-making tools.
5. Improved Patient Care & Safety
Medical dashboard and patient dashboard improve outcomes by flagging high-risk patients, enabling timely interventions, and supporting care coordination across teams. Hospitals using clinical dashboards report a reduction in medical errors, ensuring safer, more efficient care delivery.
What Essential Healthcare Dashboard KPIs Should Organizations Track?
Successful dashboard implementations focus on key performance indicators that directly impact organizational goals and user decision-making needs.
Healthcare data analytics consulting can help organizations identify and prioritize the most relevant KPIs to monitor, ensuring dashboards drive actionable insights across clinical, operational, and financial areas.
Clinical KPIs
Clinical performance indicators focus on patient care quality and safety outcomes that directly affect patient experience and regulatory compliance. Readmission rates provide insights into care quality and discharge planning effectiveness, while infection rates indicate the success of safety protocols and infection prevention programs.
Patient safety indicators include medication error rates, fall rates, and hospital-acquired condition frequencies. These metrics help healthcare teams identify areas requiring process improvements and monitor the effectiveness of safety initiatives over time.
Operational KPIs
Operational metrics track the efficiency and effectiveness of hospital processes and resource utilization. Bed utilization rates indicate capacity management effectiveness, while average length of stay metrics reveal opportunities for care process optimization and discharge planning improvements.
Staffing metrics include nurse-to-patient ratios, overtime percentages, and staff satisfaction scores. These indicators help hospital administrators optimize workforce management and identify potential quality risks related to staffing levels.
Financial KPIs
Financial performance indicators monitor revenue cycle effectiveness and cost management success. Cost per patient metrics help identify opportunities for efficiency improvements, while claim denial rates indicate billing process quality and payer relationship management effectiveness.
Revenue metrics include gross charges, net revenue, and collection percentages that track the organization’s financial health. Days in accounts receivable measures the efficiency of billing and collection processes, while payer mix analysis helps forecast future revenue trends.
Patient Experience KPIs
Patient experience metrics track satisfaction levels and identify opportunities for service improvements. Patient satisfaction scores from standardized surveys provide benchmarking data and identify areas requiring attention to improve patient experience.
Net promoter scores measure patient loyalty and likelihood to recommend the organization to others. These metrics correlate with clinical outcomes and financial performance, making them valuable indicators of overall organizational success.
Primary Users Who Benefit from Healthcare Dashboards
Different healthcare professionals use dashboard technology in distinct ways based on their roles, responsibilities, and information needs within the organization.
Clinicians & Nurses
Medical professionals utilize healthcare dashboards to observe patient health status, measure treatment advancement, and synchronize care activities. Nursing staff access these platforms to oversee multiple patient responsibilities effectively, while doctors employ dashboards to evaluate patient conditions and formulate treatment plans using integrated data perspectives.
Instant notifications alert medical personnel when patient situations deteriorate or essential tasks demand action. This immediate communication framework helps guarantee that critical patient requirements receive timely intervention despite workload demands or personnel transitions.
Hospital Administrators
Administrative staff rely on operational dashboards to monitor hospital performance, manage resources, and optimize patient flow. These medical dashboard implementations often draw on big data implementation strategies to integrate information from multiple departments, helping administrators identify bottlenecks, allocate resources effectively, and respond quickly to operational challenges that affect patient care.
Capacity management tools within administrative dashboards enable proactive planning for patient admissions, discharge coordination, and resource allocation. This visibility helps prevent overcrowding and ensures appropriate staffing levels across hospital units.
Financial Managers
Revenue cycle staff use financial dashboards to monitor billing performance, track collection activities, and identify opportunities for revenue optimization. These tools provide real-time visibility into financial metrics that enable quick responses to billing issues and payer problems.
Cost management capabilities help financial managers identify spending patterns, track budget performance, and optimize resource allocation across departments. Healthcare KPI dashboard in this category typically focus on metrics that directly impact organizational profitability.
Executives & Leadership
Senior leadership uses executive dashboards to monitor overall organizational performance and track progress toward strategic goals. These high-level tools consolidate operational, clinical, and financial metrics into comprehensive scorecards that support strategic decision-making.
Board reporting capabilities within executive dashboards provide standardized performance summaries that facilitate governance activities and strategic planning discussions. Trend analysis features help leaders identify emerging opportunities and challenges that require organizational responses.
Quality & Compliance Teams
Quality improvement staff use specialized dashboards to monitor clinical performance metrics, track patient safety indicators, and ensure regulatory compliance.
Integrating an AI data extraction solution can streamline the collection and processing of clinical data, helping identify areas requiring process improvements and monitor the effectiveness of quality initiatives over time.
Regulatory reporting capabilities automate much of the data collection required for external reporting requirements, reducing administrative burden while ensuring accuracy and timeliness of regulatory submissions.
IT & Data Teams
Information technology staff use dashboard tools to monitor system performance, data quality, and integration effectiveness. Many teams also leverage big data platforms to aggregate and process large volumes of clinical and operational information, ensuring healthcare applications remain available and perform effectively under operational demands
Data quality monitoring capabilities identify inconsistencies or errors in source systems that could affect dashboard accuracy. This proactive monitoring helps maintain user confidence in dashboard information and prevents decision-making based on inaccurate data.
How Do Organizations Determine the Ideal Healthcare Dashboard?
Successful dashboard selection requires careful consideration of organizational requirements, technical capabilities, and user needs across different stakeholder groups.
Step 1: Define Your Goals
Organizations must clearly identify their primary objectives for dashboard implementation before evaluating specific technology solutions. Clinical goals might focus on improving patient safety or care coordination, while operational objectives could emphasize capacity management or resource optimization.
Financial goals often center on revenue cycle improvement or cost reduction opportunities. Clear goal definition helps organizations evaluate dashboard features and capabilities against specific success criteria rather than generic functionality checklists.
Step 2: Identify Key Metrics
Successful implementations focus on a limited set of high-impact metrics rather than attempting to display every available data point. Organizations using data and analytics services should identify the specific key performance indicators that directly support their defined goals and user decision-making needs.
Metric selection requires input from end users who will rely on dashboard information for daily operations. Healthcare analytics dashboard demonstrate that user involvement in metric selection significantly improves adoption rates and overall program success.
Step 3: Check Integration Capabilities
Successful implementations focus on a limited set of high-impact metrics rather than attempting to display every available data point. Organizations should identify the specific key performance indicators that directly support their defined goals and user decision-making needs.
Integration complexity and costs can vary significantly among different dashboard solutions. Organizations should prioritize solutions that offer pre-built connectors for their existing systems while maintaining flexibility for future system additions or changes.
Step 4: Ensure Data Accuracy & Security
Medical institutions function within rigorous regulatory frameworks for information confidentiality and protection. Dashboard platforms must adhere to HIPAA standards and institutional security protocols while preserving user accessibility to essential information.
Information precision relies on seamless connectivity with origin systems and comprehensive data verification procedures. Institutions should assess how dashboard solutions manage data integrity challenges and instill user trust in the information presented.
Step 5: Evaluate User Experience
Dashboard adoption depends heavily on user experience design and ease of use across different user communities. Healthcare professionals have limited time for training and expect intuitive interfaces that support their existing workflows. Engaging healthcare data analytics consulting can help design dashboards that align with user needs while ensuring actionable insights are accessible and relevant.
Role-based access capabilities ensure that users see relevant information without being overwhelmed by unnecessary details. Patient dashboard examples show how effective design focuses user attention on the most critical information for their specific responsibilities.
Healthcare Dashboard Success Stories: Real-World Case Studies
Leading healthcare organizations have achieved measurable improvements through strategic dashboard implementations that address specific operational challenges.
Case Study 1: Cleveland Clinic – Reducing Hospital-Acquired Infections
- Challenge: Cleveland Clinic’s Neurological ICU faced persistently high rates of hospital-acquired infections that threatened patient safety and increased costs. Cleveland Clinic’s high-acuity Neurological ICU staff developed multidisciplinary “tackle teams” to identify infection sources and develop aggressive action plans to avert infections from those sources.
- Dashboard Solution: The organization implemented a comprehensive infection tracking dashboard that monitored real-time infection rates, identified high-risk patients, and tracked compliance with infection prevention protocols. The system integrated data from laboratory systems, nursing documentation, and quality metrics to provide complete visibility into infection patterns.
- Results: The efforts have brought dramatic, enduring reductions in hospital-acquired infections. The dashboard enabled early identification of infection trends and immediate intervention when protocol compliance declined, resulting in sustained improvements in patient safety outcomes.
- Source: https://consultqd.clevelandclinic.org/tackling-hospital-acquired-infections-in-a-high-acuity-neuro-icu/
Case Study 2: Mayo Clinic – YES Board for Emergency Department Flow
- Challenge: Mayo Clinic’s emergency departments struggled with patient flow management, leading to extended wait times and reduced patient satisfaction. Traditional tracking methods couldn’t provide the real-time visibility needed for effective capacity management during peak demand periods.
- Dashboard Solution: Mayo Clinic developed the YES Board dashboard system that provides real-time situational awareness for emergency department operations. The system displays current patient locations, treatment progress, resource availability, and staffing levels in an intuitive visual interface that enables rapid decision-making.
- Results: No formal study has been designed to see how much time the system has saved in the ER, but he believes that it cuts patient stays by 30 minutes to an hour. The dashboard implementation improved patient flow efficiency and reduced wait times significantly across Mayo Clinic emergency departments.
- Source: https://medcitynews.com/2012/04/mayo-clinic-docs-real-time-dashboard-makes-er-patient-tracking-easier/
Case Study 3: Henry Mayo Newhall Hospital – Emergency Department Analytics Dashboard
- Challenge: Henry Mayo Newhall Hospital needed better visibility into emergency department performance metrics to optimize patient care and resource allocation. Manual tracking processes couldn’t provide the real-time insights necessary for effective operational management.
- Dashboard Solution: The hospital implemented a comprehensive emergency department analytics dashboard that tracks key performance indicators including patient wait times, throughput metrics, staffing levels, and quality measures. The system provides automated alerts when performance thresholds are exceeded.
- Results: The dashboard implementation enabled proactive management of emergency department operations, resulting in improved patient satisfaction scores and more efficient resource utilization during high-demand periods.
- Source: https://www.healthcare.dimins.com/resources/case-studies/henry-mayo-newhall-hospital/
Case Study 4: Cleveland Clinic – Patient Experience Dashboard
- Challenge: Cleveland Clinic needed better visibility into patient experience metrics across multiple service lines to identify improvement opportunities and track the effectiveness of patient satisfaction initiatives.
- Dashboard Solution: The organization developed a comprehensive patient experience dashboard that consolidates satisfaction survey data, complaint tracking information, and quality metrics into unified views. The system enables drill-down analysis by department, service line, and time period.
- Results: The dashboard implementation helped Cleveland Clinic identify specific areas for patient experience improvement and track the effectiveness of targeted interventions, resulting in measurable improvements in patient satisfaction scores across the organization.
- Source: https://my.clevelandclinic.org/departments/patient-experience/depts/office-patient-experience/measurement
FAQs
What are the most common types of healthcare dashboards used in hospitals?
Popular healthcare dashboard examples include clinical dashboards for patient monitoring, operational dashboards, revenue cycle dashboard, executive dashboards, and population health dashboards, each is customised to specific needs.
How do healthcare dashboards improve patient care?
Healthcare dashboard give real-time visibility into patient conditions, treatment progress, and care coordination, enabling timely interventions and improved outcomes.
Can healthcare dashboards integrate with EHR and EMR systems?
Yes, modern medical dashboards integrate with EHR/EMR systems via APIs, providing real-time data access while ensuring compliance and security.
What is the difference between a healthcare analytics dashboard and a reporting tool?
Healthcare analytics dashboard offer interactive visualizations, drill-down insights, and alerts, while reporting tools generate static, scheduled reports.
What are the biggest challenges when implementing healthcare dashboards?
Common hurdles include data integration, training, accuracy, compliance, and costs, the success relies on strong project and change management.
How do AI and predictive analytics enhance healthcare dashboards?
AI-powered healthcare KPI dashboard predict risks, optimize resource use, and provide proactive recommendations to improve care and efficiency.
How do healthcare dashboards improve decision-making for clinicians and executives?
Dashboards consolidate KPIs into single views, enabling data-driven decisions, predictive insights, and real-time clinical and operational planning.
What role do real-time dashboards play in emergency departments?
Emergency-focused medical dashboards track patient volumes, wait times, and bed availability, helping optimize patient flow and resource allocation.
Can small clinics and private practices also use healthcare dashboards?
Yes, cloud-based healthcare dashboards make advanced tools accessible, offering simplified patient dashboard and financial performance tracking.
Conclusion
Healthcare dashboard examples show how real-time visualization drives better patient outcomes, operational efficiency, and financial performance. Aligning healthcare analytics dashboard with specific organizational goals ensures dashboards deliver actionable insights instead of overwhelming data.
As value-based care models and regulatory pressures rise, dashboards will become indispensable for data-driven decision-making. Emerging technologies like AI and predictive analytics will further improve these tools.
To maximize impact, partner with experts like Folio3, who deliver secure, customized solutions that help healthcare organizations optimize performance, improve patient care, and build resilience through smarter data strategies.