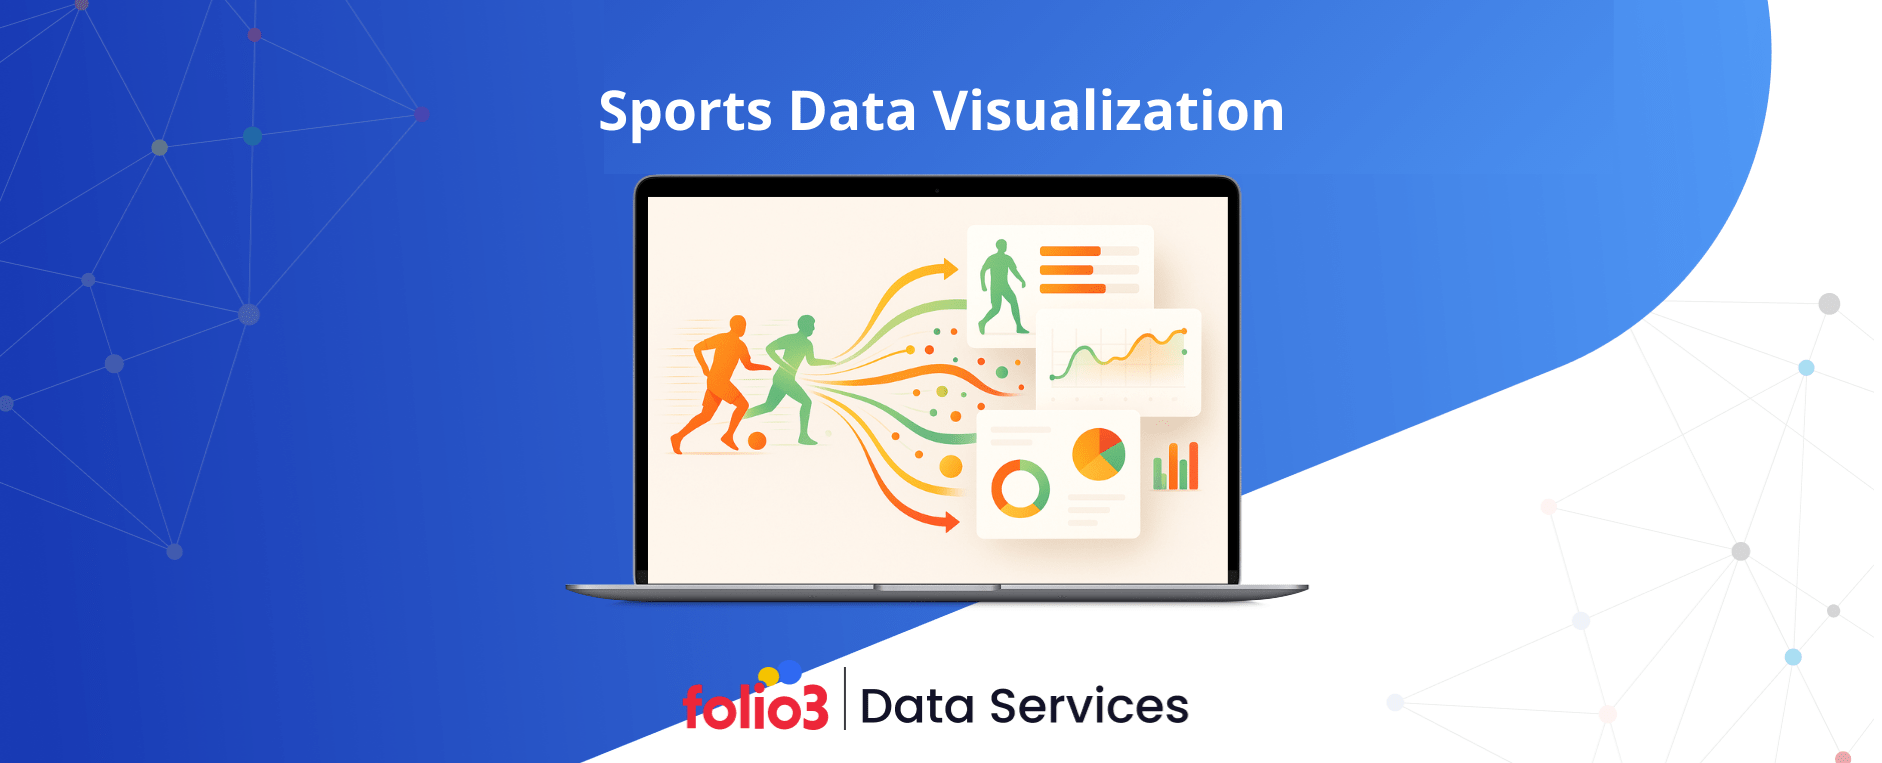
This in-depth guide explains sports data visualization with practical examples, essential tools, visualization comparisons, benefits, implementation steps, best practices, and success stories from leading sports organizations.
This in-depth guide explains sports data visualization with practical examples, essential tools, visualization comparisons, benefits, implementation steps, best practices, and success stories from leading sports organizations.
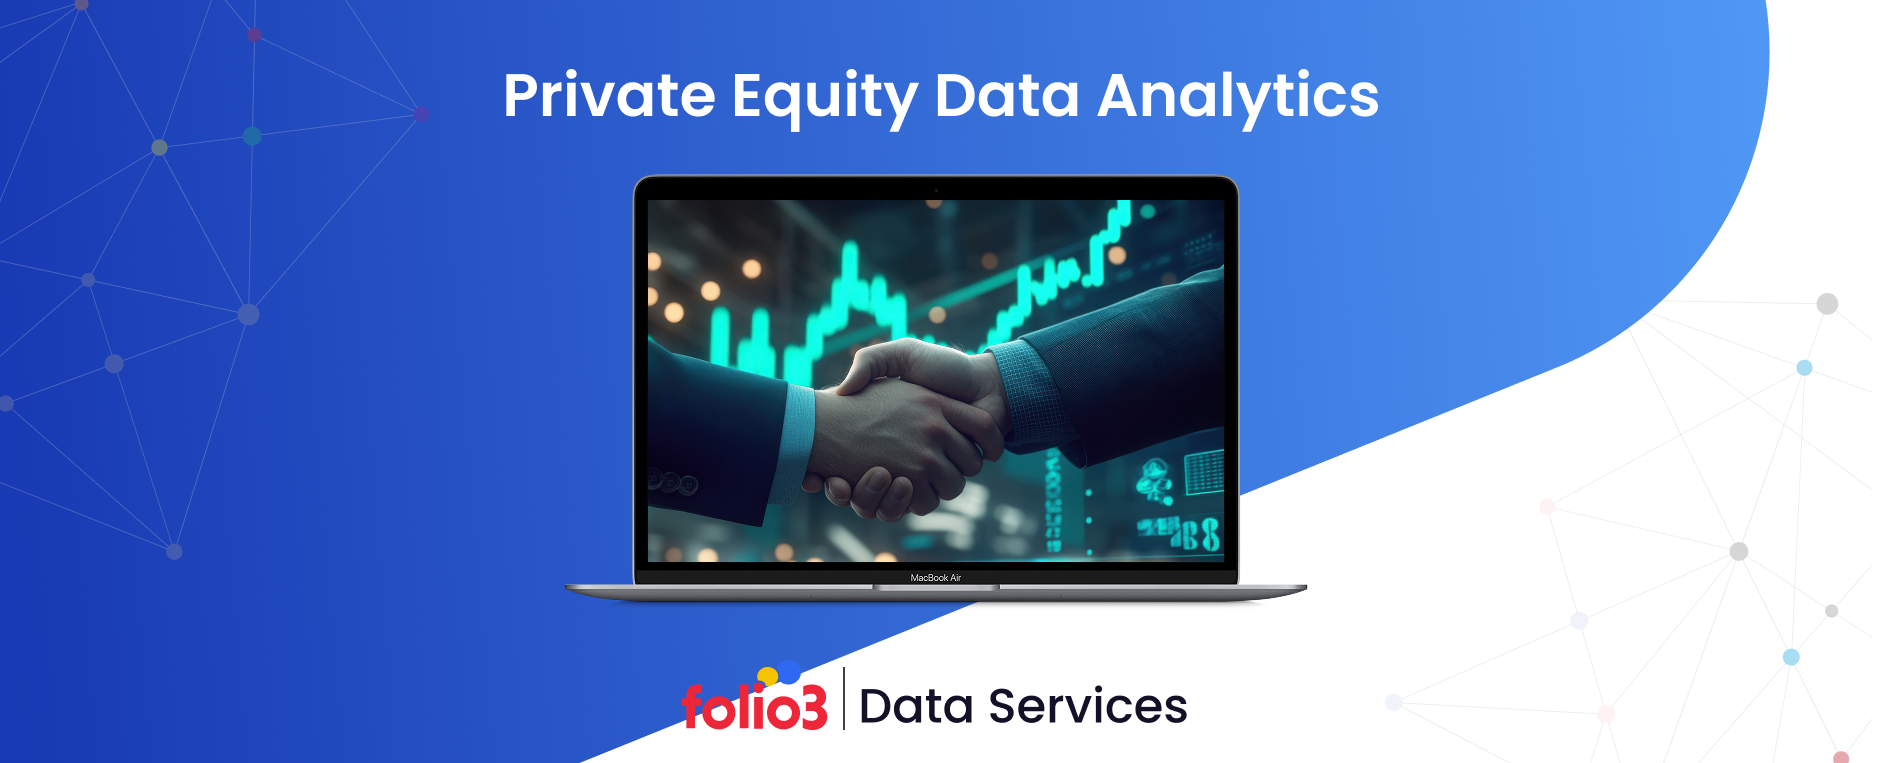
See how data analytics reshapes private equity through actionable insights, predictive modeling, and smarter deal sourcing. Learn how leading firms achieve success with data-driven strategies.
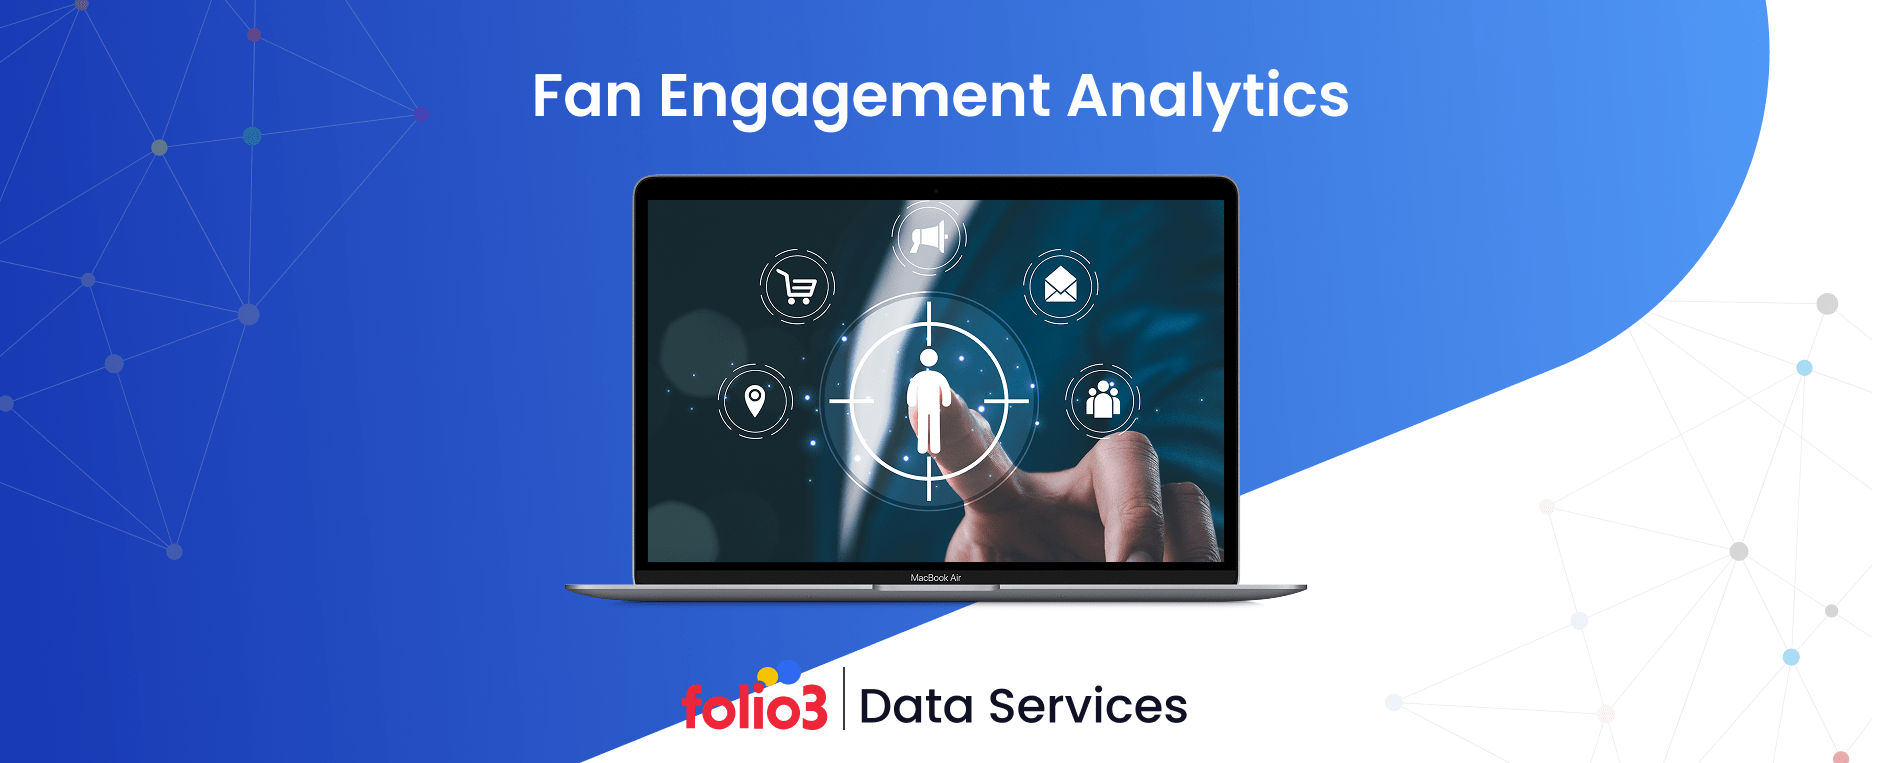
Fan engagement analytics helps sports teams understand fans, personalise experiences, boost loyalty, reduce churn, and increase revenue through data-driven insights and audience behaviour analysis.
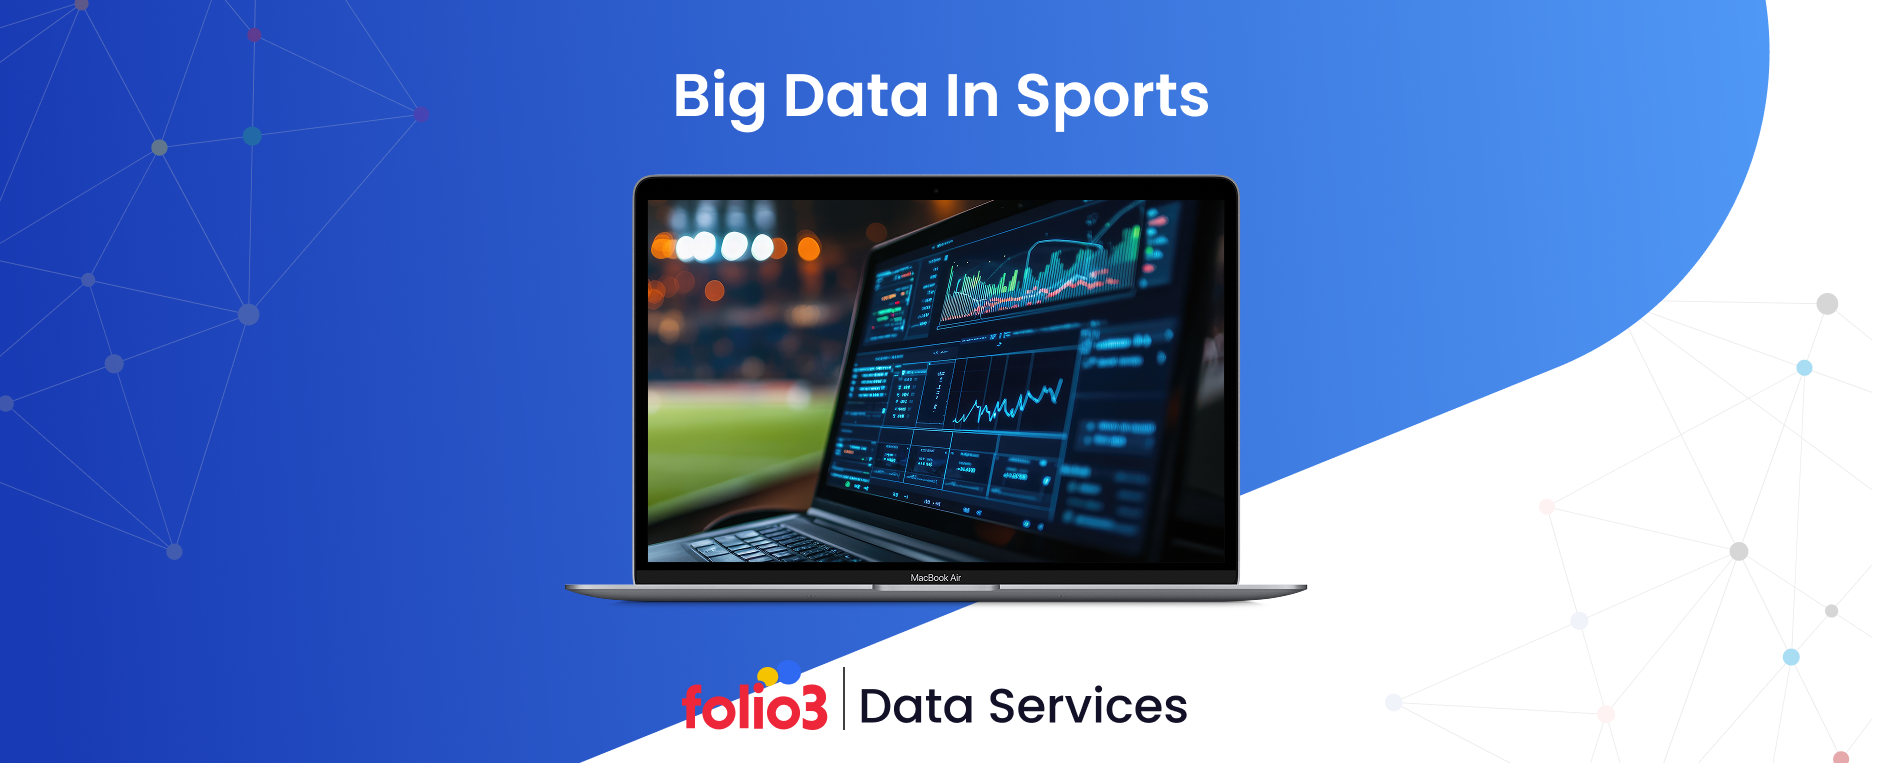
Big data in sports revolutionizes athlete training, talent scouting, strategy, and fan engagement. By analyzing data from wearables and tracking systems, teams make smarter decisions across performance and business operations.
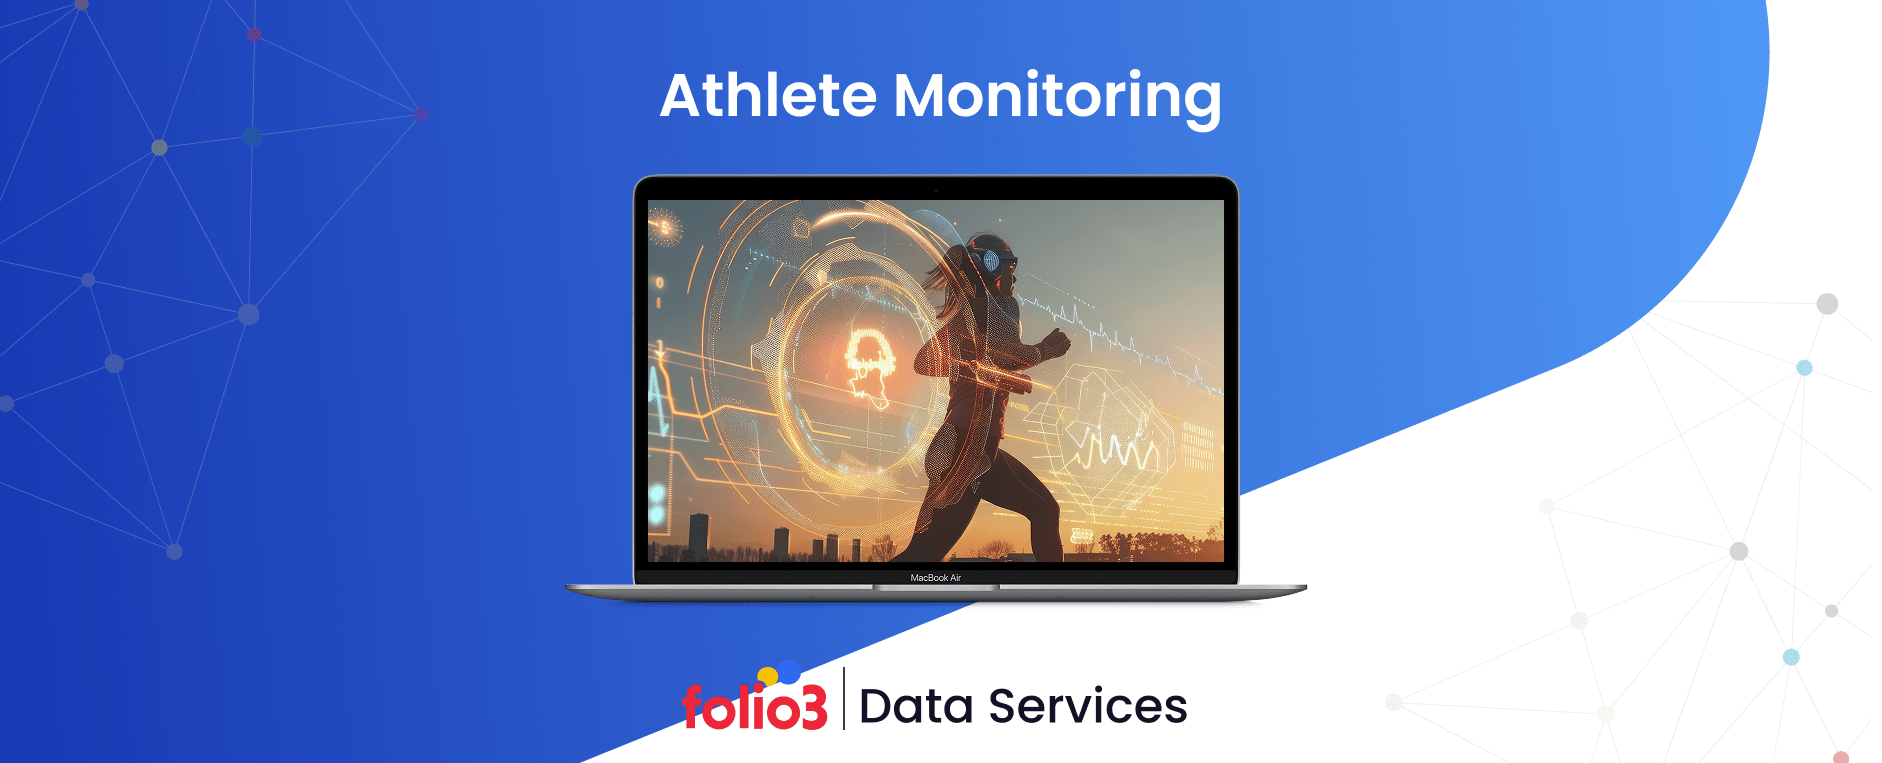
Understand athlete monitoring and how it helps teams optimize performance, reduce injuries, and improve training outcomes. Learn about key system components, use cases, challenges, and best practices for implementing an effective monitoring solution.
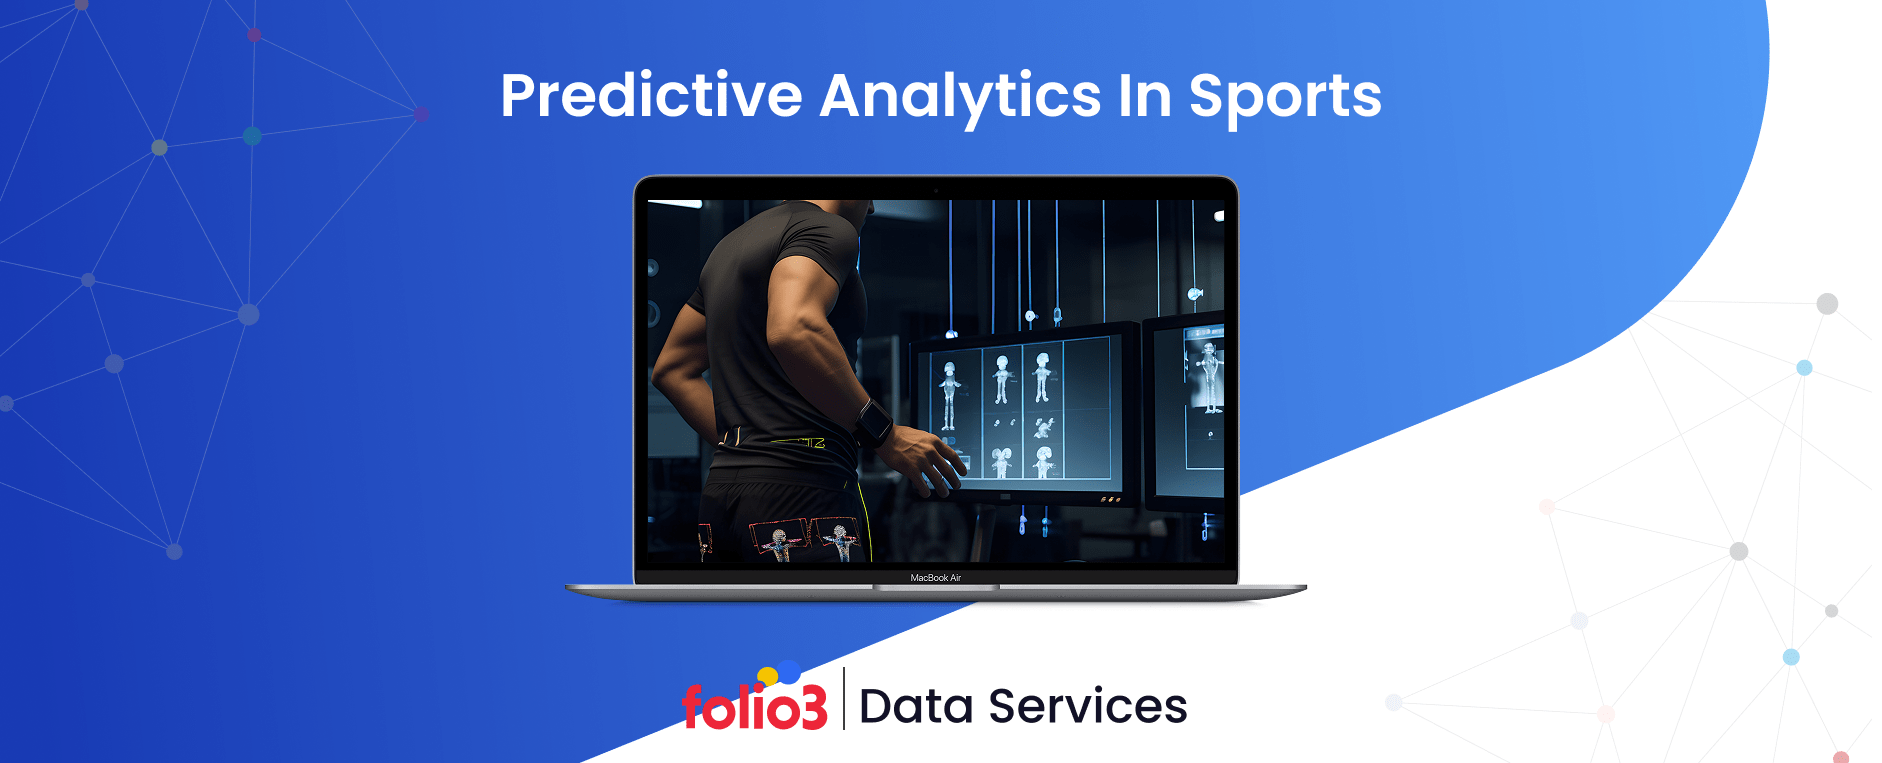
Predictive analytics in sports uses data, statistics, and machine learning to forecast performance, prevent injuries, optimize strategies, and boost fan engagement, giving teams a competitive edge in performance and revenue.
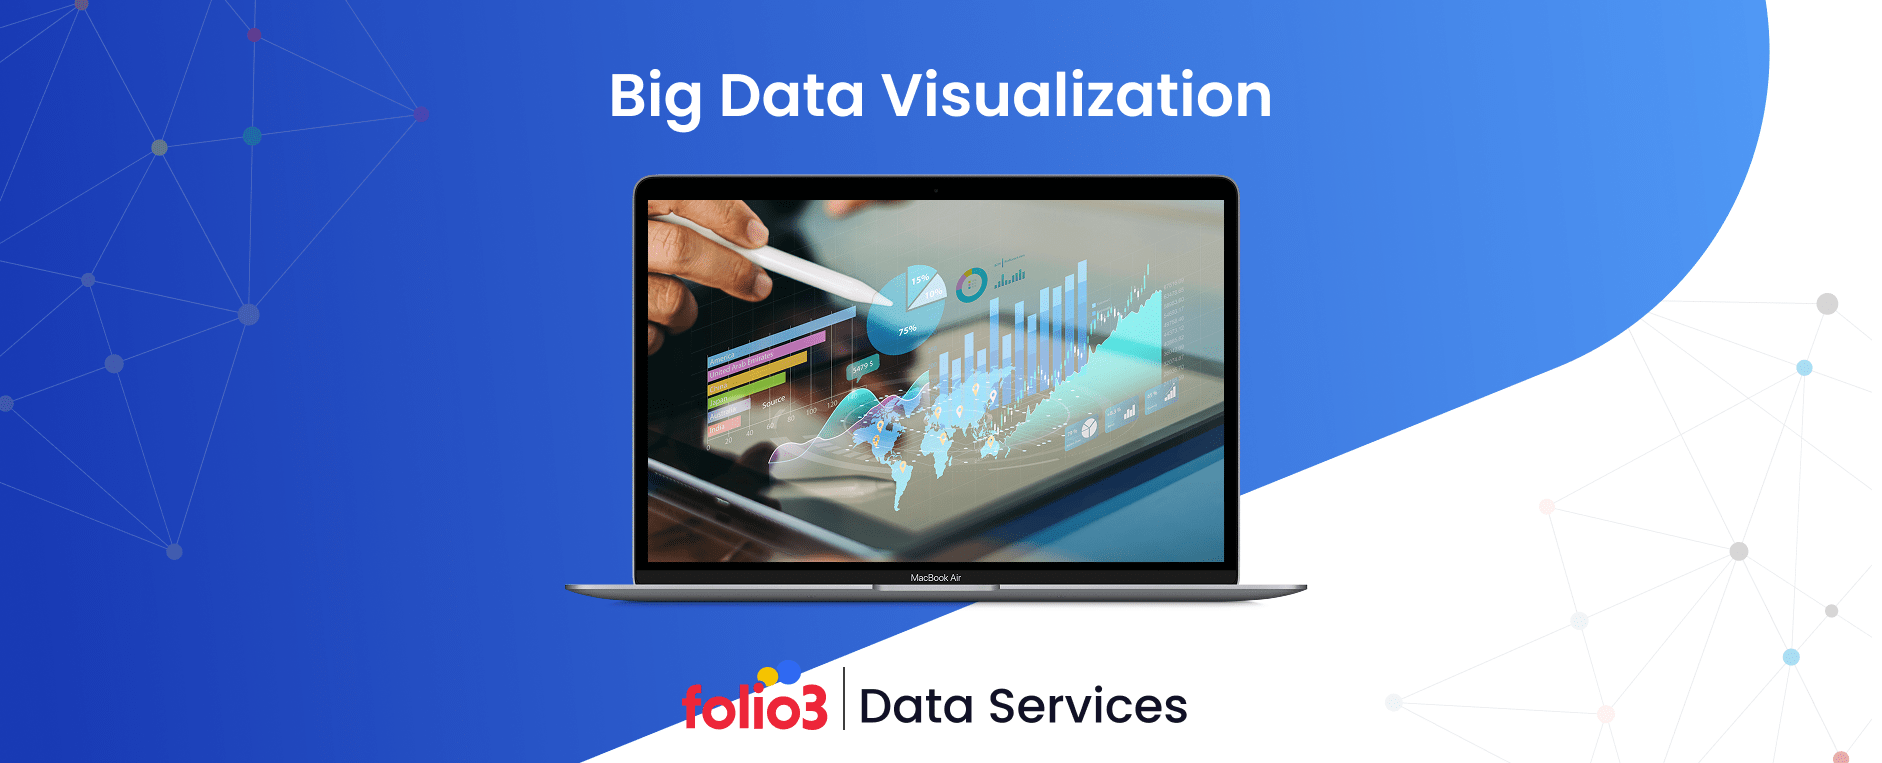
Big data visualization helps organizations turn massive, complex datasets into clear, actionable insights. This guide explores visualization types, tools, workflows, and strategies to help businesses make smarter, data-driven decisions with confidence.
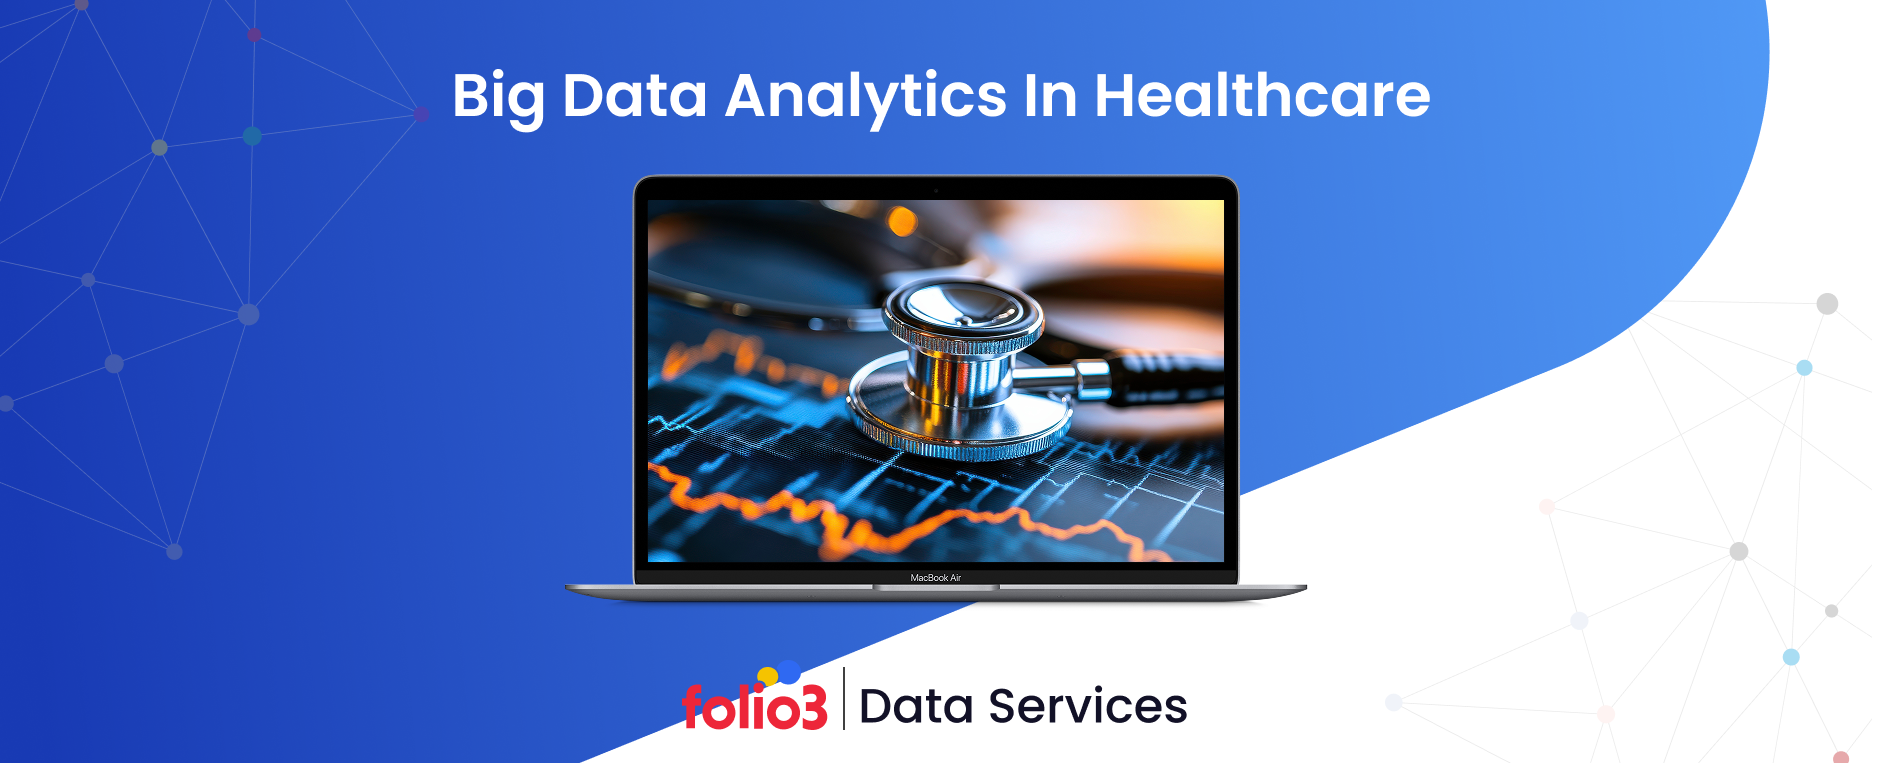
Learn how big data analytics is reshaping healthcare by integrating AI, enhancing decision-making, reducing costs, overcoming challenges, and driving real-world improvements in patient care and operational efficiency.
Learn how retailers can achieve end-to-end supply chain visibility using modern technologies, best practices, and real-world examples to enhance performance and customer satisfaction.
Learn how data-driven healthcare supply chain analytics addresses challenges, enhances efficiency, supports strategic decisions, and ensures better outcomes for patients and providers.