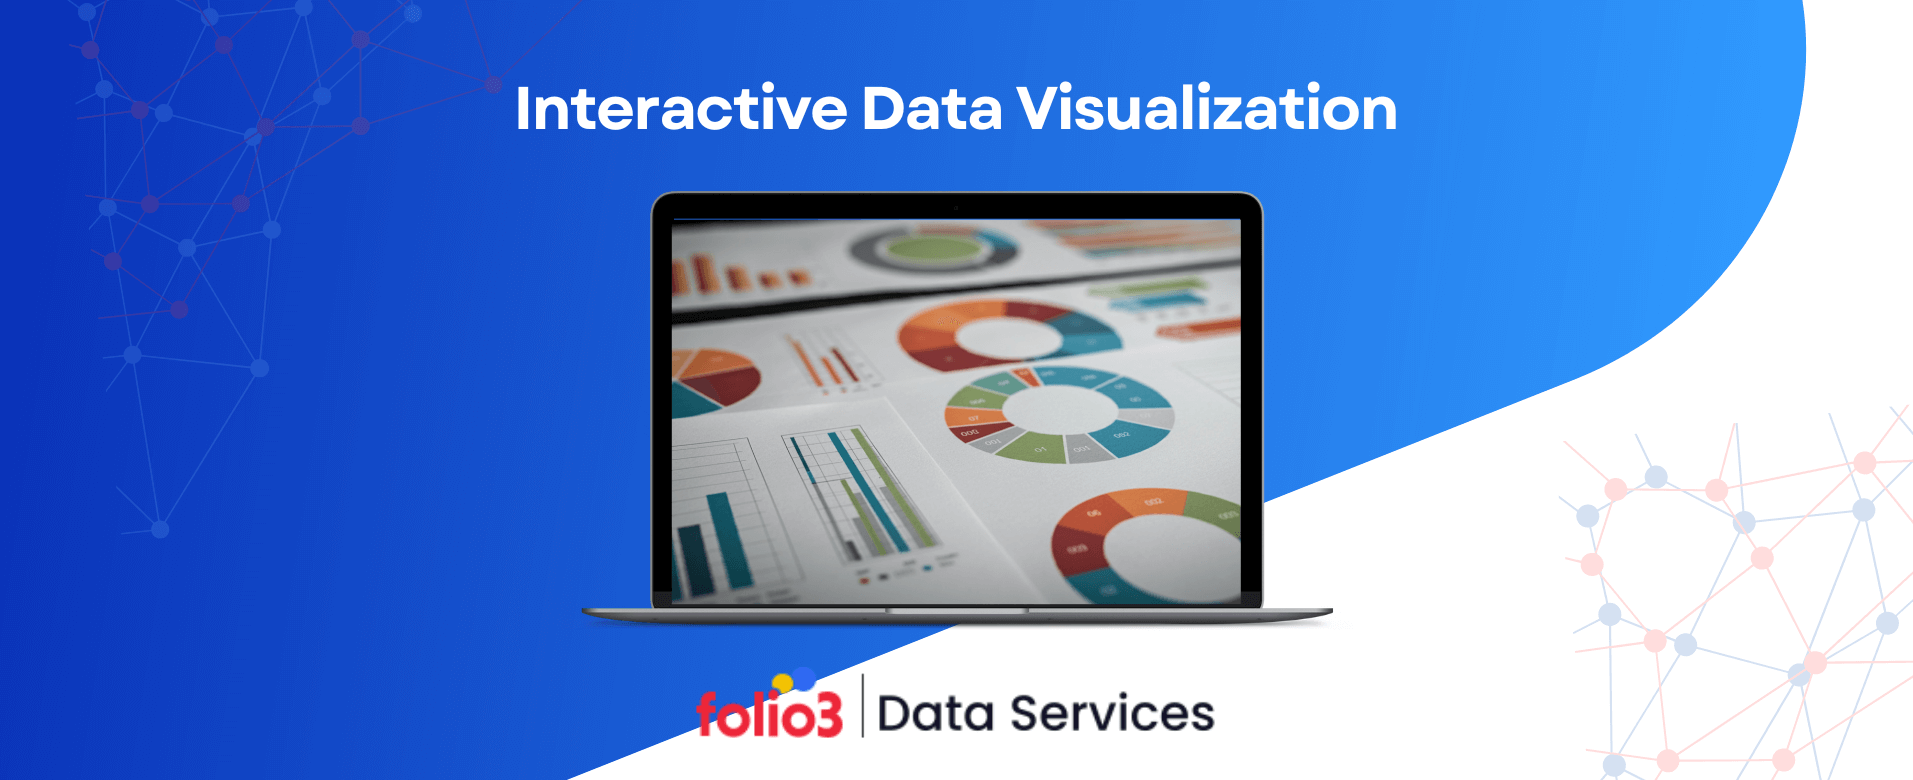

Data is everywhere, but making sense of it is a challenge. With global data expected to reach 181 zettabytes by 2025, businesses and decision-makers need more than just numbers—they need clarity. This is where interactive data visualization comes in. Unlike static charts that merely present figures, interactive dashboards allow users to explore, filter, and analyze data dynamically.
From tracking real-time financial trends to monitoring global supply chain movements, interactive tools make complex datasets more accessible and actionable. Over the years, data visualization has evolved from basic bar charts to advanced, interactive models that drive better decision-making.
This guide explores what interactive data visualization is, why it matters, and the best interactive data visualization examples showcasing its impact across industries.
What is Interactive Data Visualization?
Interactive data visualization is the advanced form of traditional data representation that enables users to engage with datasets dynamically. Unlike static charts or graphs, interactive visuals allow users to zoom, filter, drill down, and customize the real-time data display. This approach enhances decision-making by providing deeper insights through hands-on exploration.
For example, in financial analytics, interactive dashboards help investors track real-time stock market fluctuations, compare historical trends, and adjust variables to predict future performance. The best interactive data visualization example can be seen in COVID-19 tracking dashboards, where users can filter cases by region, time frame, and severity level.
As organizations generate vast amounts of data—over 328.77 million terabytes daily—interactive tools have become essential for breaking complex datasets into actionable insights. Whether for business intelligence, healthcare analytics, or customer behavior analysis, interactive visualizations transform raw data into meaningful, user-driven narratives.
Benefits of Interactive Data Visualization
Interactive data visualization goes beyond static charts by allowing users to explore, analyze, and interpret data in real time. It enhances decision-making by making complex information more accessible through dynamic dashboards, filters, and drill-down capabilities. Businesses can instantly uncover hidden trends, monitor key metrics, and communicate insights more effectively, leading to smarter strategies and improved outcomes.
Better Decision-Making
Interactive data visualization empowers businesses to make informed decisions by presenting complex datasets clearly and engagingly. It enables users to analyze trends, spot anomalies, and uncover hidden insights that static reports might miss.
Enhanced Data Exploration
Unlike static charts, interactive tools allow users to filter, drill down, and customize views to explore data from multiple angles. This flexibility ensures deeper analysis and more accurate conclusions.
Real-Time Monitoring
With real-time data updates, businesses can instantly track key performance indicators (KPIs). Industries like finance, healthcare, and e-commerce rely on live dashboards to respond efficiently to market changes, customer behaviors, and operational performance.
Improved Data Storytelling
Interactive data visualization makes it easier to communicate insights by turning raw numbers into compelling stories. Organizations can create engaging narratives that drive strategic discussions by combining charts, maps, and dashboards.
Increased Engagement & Usability
User-friendly interfaces make interactive visualizations accessible to both data experts and non-technical users. Features like hover effects, dynamic filters, and zoom options enhance usability, ensuring stakeholders can derive value without needing advanced analytical skills.
Best Practices for Creating Interactive Data Visualizations
Designing compelling interactive data visualizations requires a strategic approach to ensure clarity, usability, and impact. Following best practices, businesses can create engaging, data-driven experiences that enhance decision-making and storytelling.
- Choosing the right visualization – Select the best chart type based on your data and the insights you want to convey.
- Simplify user experience – Keep interactions intuitive, ensuring users can easily explore data without confusion.
- Ensuring accessibility – Design visualizations that accommodate all users, including those with disabilities.
- Optimizing performance – Ensure fast loading times and responsiveness, even with large datasets.
- Avoiding common pitfalls – Prevent misleading visuals, cluttered dashboards, and excessive animations that can hinder comprehension.
Applications of Interactive Data Visualization
Interactive data visualization transforms industries by making complex data more accessible, actionable, and engaging. From business strategy to healthcare innovations, the ability to explore and analyze data in real time is a game-changer. Across these industries, interactive data visualization examples showcase how real-time insights drive efficiency, innovation, and competitive advantage.
Let’s explore how different sectors use interactive data visualization to drive better decisions.
1. Business and Finance
Data-driven decision-making is critical in the financial world, where every second counts. Interactive dashboards help businesses track KPIs, monitor stock market trends, and analyze financial risks. By using business data analytics services, organizations can create dynamic visualizations that enable traders to interact with live financial data, compare market trends, and make informed investment decisions.
- Fraud detection: Banks use real-time visual analytics to spot fraudulent transactions and anomalies.
- Portfolio management: Investors interact with real-time market data to optimize their portfolios.
- Risk assessment: Businesses analyze financial data through dynamic charts to assess potential risks.
2. Healthcare
In healthcare, interactive visualizations make monitoring patient outcomes, tracking disease outbreaks, and optimizing hospital operations easier. Many hospitals and research institutions leverage Tableau consulting services to implement and customize dashboards, ensuring that critical patient data is analyzed effectively for better decision-making.
Best interactive data visualization tools like Tableau and Power BI are widely used to analyze patient data.
- Medical imaging analysis: Interactive 3D models help radiologists detect diseases more accurately.
- Epidemiology tracking: Organizations like the CDC use interactive maps to monitor the spread of diseases like COVID-19.
- Operational efficiency: Hospitals use real-time dashboards to track patient wait times, resource allocation, and treatment effectiveness.
3. Retail and E-commerce
Retailers use interactive data visualization to understand consumer behavior, track sales performance, and optimize inventory. With real-time analytics, businesses can adjust marketing strategies and stock levels to meet demand.
- Customer segmentation: Businesses analyze purchase history and preferences using interactive heatmaps.
- Supply chain optimization: Retailers monitor supply chain disruptions and adjust logistics using real-time dashboards.
- Product performance analysis: Companies track which products are trending and adjust marketing efforts accordingly.
4. Marketing and Advertising
Interactive data visualization revolutionizes how marketers measure campaign effectiveness, track audience engagement, and optimize advertising strategies. What is interactive data visualization in marketing? It’s the ability to analyze real-time ad performance, website traffic, and customer sentiment through dynamic dashboards.
- Social media analytics: Marketers use interactive reports to track audience engagement and sentiment analysis.
- Campaign performance monitoring: Advertisers use live dashboards to adjust strategies in real time based on audience response.
- SEO and web traffic analysis: Interactive tools like Google Analytics visualize website traffic patterns to improve marketing decisions.
FAQs
What is interaction for data visualization?
Interaction in data visualization allows users to explore and manipulate data dynamically, such as filtering, zooming, and drilling down for deeper insights.
What are interactive visuals?
Interactive visuals are graphics, charts, or dashboards that respond to user input, enabling real-time data exploration and personalized insights.
What is the difference between static and interactive data visualization?
Static data visualization presents fixed, unchangeable graphics, while interactive data visualization allows users to interact with and analyze data dynamically.
What is interactive data analysis?
Interactive data analysis enables users to explore datasets in real time using interactive tools, filters, and visual elements to uncover meaningful patterns and trends.
Conclusion
Interactive data visualization transforms complex datasets into clear, actionable insights, empowering businesses across industries to make informed decisions. By leveraging real-time data, interactive visuals enhance engagement, improve storytelling, and drive strategic growth.
Organizations need advanced tools and expertise to make the most of these benefits. Folio3 Cloud and Data Services provide tailored solutions for seamless data integration, visualization, predictive analytics services, and business intelligence. Contact Folio3 today to optimize your data strategy and unlock the full potential of interactive data visualization for your business success.