Understanding and interpreting data is no longer a luxury but a necessity for businesses striving to maintain a competitive edge. Business Intelligence (BI) reporting has emerged as a critical tool that enables organizations to transform raw data into actionable insights. But what exactly is business intelligence reporting, and why has it become so essential?
The evolution of BI reporting has come a long way. Traditional static reports, which often consisted of spreadsheets and lengthy documents, provided limited value due to their inability to adapt to fast-changing market dynamics. Modern dashboards and interactive business intelligence reporting systems offer real-time insights, predictive analysis, and customizable views that empower stakeholders to make informed decisions.
Recent studies have demonstrated that companies using Business Intelligence (BI) reporting tools are five times more likely to make faster, data-driven decisions. For instance, organizations utilizing data analytics are five times more likely to make decisions more swiftly than their competitors.
Additionally, research indicates that companies employing BI tools are five times more likely to make faster decisions, underscoring the significant impact of BI on decision-making efficiency. From understanding consumer behavior to identifying operational inefficiencies, business intelligence reports examples demonstrate the tangible benefits of leveraging data effectively.
In this article, we’ll explore what a BI report is, the various types of reports in business intelligence, and the best practices for implementing reporting tools in business intelligence.
Types of Business Intelligence Reports
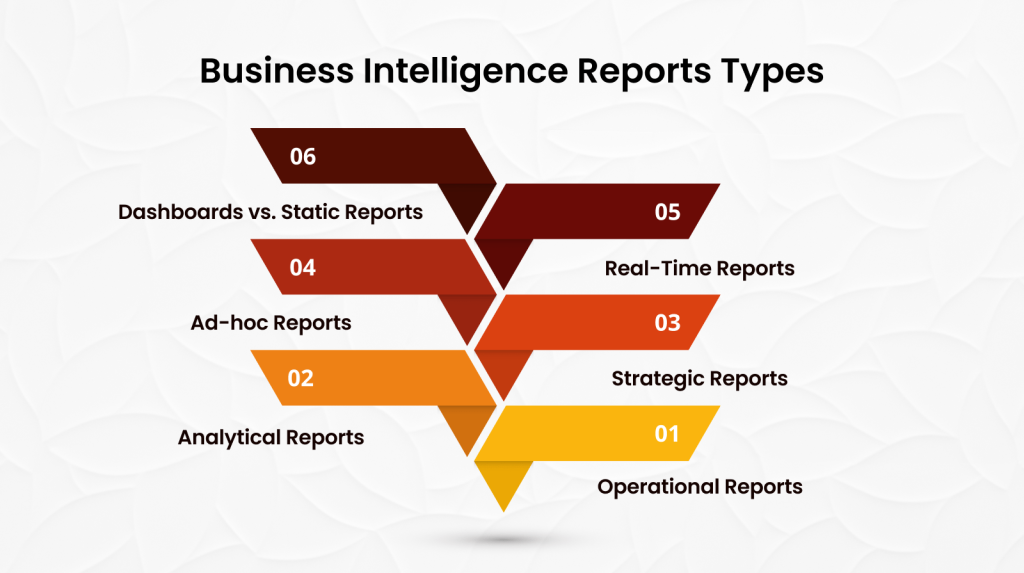
Business intelligence reporting systems generate various types of reports to meet different business needs. Understanding these types of reports in business intelligence can help organizations choose the right business intelligence services and ensure data-driven decision-making across all levels.
Here are the main categories:
1. Operational Reports
Operational reports provide real-time insights into day-to-day activities. Managers and operational teams typically use them to monitor performance metrics, track processes, and ensure smooth operations. For example, a logistics company might use operational reports to track delivery statuses and inventory levels using data visualization services for quick interpretation.
2. Analytical Reports
Analytical reports are designed for in-depth data analysis. They enable businesses to identify trends, patterns, and correlations that inform strategic decisions. Analysts can use advanced data analytics services and reporting tools in business intelligence to explore factors affecting sales, customer behavior, or market trends.
3. Strategic Reports
Strategic reports focus on long-term goals and high-level insights. Executives and senior management rely on these reports to assess company performance, evaluate growth opportunities, and plan future initiatives. Business intelligence reports examples include financial summaries, market share analysis, and competitive benchmarking.
4. Ad-hoc Reports
Ad-hoc reports are generated on demand to address specific business questions. Unlike scheduled reports, they are highly customizable and often used by business users without extensive technical expertise. BI reporting tools facilitate easy access to data, allowing quick decision-making without relying heavily on IT support.
5. Real-Time Reports
Real-time reports provide up-to-the-minute data, offering instant visibility into business operations. Companies like e-commerce, finance, and logistics often use real-time reports to monitor critical KPIs and respond promptly to emerging trends or issues.
6. Dashboards vs. Static Reports
Dashboards offer an interactive, visual representation of data from multiple sources. They allow users to drill down into specific metrics and customize views for a comprehensive analysis. On the other hand, static reports are fixed, and printable documents are used for formal reporting and record-keeping. While dashboards are ideal for dynamic data exploration, static reports remain essential for regulatory compliance and auditing.
Best Practices for Effective BI Reporting
Implementing best practices can significantly enhance the effectiveness of business intelligence reporting. By following these best practices, companies can optimize their business intelligence reporting systems, turning data into actionable insights and driving informed decision-making at all levels of the organization.
Here’s how organizations can maximize the value of their reports:
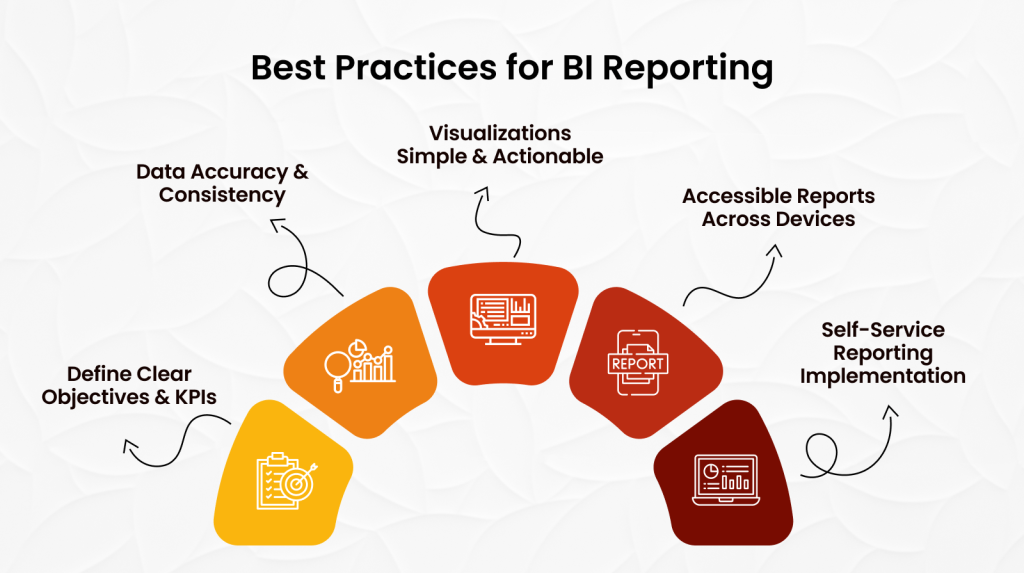
1. Define Clear Objectives and KPIs
Before generating a report, businesses should establish specific objectives and identify the key performance indicators (KPIs) that align with their goals. For example, an e-commerce company might track conversion rates and average order value as primary metrics in its BI reporting.
2. Ensure Data Accuracy and Consistency
Accurate and consistent data is crucial for reliable reporting. Business intelligence reporting systems should integrate data from multiple sources, validate accuracy, and eliminate duplicates or errors.
AI data extraction can further enhance this process by automatically identifying and consolidating information from diverse data sources, improving efficiency and precision. Organizations that adopt AI for data analytics report improved decision-making accuracy. Additionally, companies utilizing data analytics are five times more likely to make faster decisions than their competitors.
3. Keep Visualizations Simple & Actionable
Complex dashboards with cluttered visuals can overwhelm users. Instead, reporting tools in business intelligence should use intuitive charts, graphs, and heatmaps that make insights easy to interpret. Studies show businesses using clear visual reports experience a 28% faster decision-making process. Specifically, managers employing data visualization tools were 28% more likely to access timely information than those using traditional reporting methods.
4. Make Reports Accessible Across Devices
Modern BI reporting platforms offer responsive designs, ensuring reports are accessible on desktops, tablets, and smartphones. This flexibility is particularly beneficial for field teams and remote decision-makers who need real-time data access.
5. Implement Self-Service Reporting Capabilities
Empowering employees with self-service reporting tools enhances productivity. With minimal training, non-technical users can generate reports and extract insights without relying on IT teams. A survey found that self-service reporting dramatically reduces the time and energy required to produce a report, enabling real-time insights and quicker decision-making.
Real Use Cases of BI Reporting Across Industries
BI reporting has proven beneficial across various sectors. By understanding these use cases, businesses can see how effective BI reporting can drive growth, improve operations, and create competitive advantages.
Here are some real-world applications:
1. Retail – Walmart
Retailers use business intelligence reporting systems to analyze customer behavior, predict trends, and optimize inventory management. Companies like Walmart utilize BI dashboards to monitor real-time sales performance across thousands of stores.
2. Healthcare – Cleveland Clinic
Hospitals and healthcare providers rely on BI reports to track patient data, manage resources, and improve treatment outcomes. For example, the Cleveland Clinic uses healthcare-focused data analytics to gain actionable insights that reduce patient readmission rates and enhance overall care quality.
3. Finance – JPMorgan Chase
Financial institutions leverage BI reporting for fraud detection, risk management, and investment analysis. Banks like JPMorgan Chase utilize BI tools to analyze transaction data and identify suspicious activities.
4. Manufacturing – General Electric
Manufacturers employ BI reports for supply chain management, quality control, and production monitoring. General Electric uses BI dashboards to optimize production efficiency and reduce downtime.
5. Logistics – FedEx
Logistics companies like FedEx rely on real-time BI reporting to track shipments, optimize delivery routes, and ensure timely deliveries. Predictive analytics also help forecast demand and manage resources effectively.
Business Intelligence Reporting – Summary
Business Intelligence (BI) reporting transforms raw data into actionable insights, empowering organizations to make faster, data-driven decisions. Modern BI reporting includes operational, analytical, strategic, ad-hoc, and real-time reports, supported by interactive dashboards. Best practices involve defining clear KPIs, ensuring data accuracy, using intuitive visualizations, and enabling self-service reporting. Across industries such as retail, healthcare, finance, manufacturing, and logistics, BI reporting improves operational efficiency, enhances customer experiences, and drives strategic growth. Folio3 Data Services provides end-to-end BI solutions to help businesses leverage reporting tools for smarter decision-making and competitive advantage.
Conclusion
Business Intelligence reporting has become crucial for organizations aiming to stay competitive in today’s data-driven landscape. Businesses can gain actionable insights, improve operational efficiency, and make well-informed decisions by leveraging BI reporting systems.
However, to make the most of the full potential of your data, it’s essential to choose the right partner for your BI implementation. That’s where Folio3 comes in. With our comprehensive Data Services, we help businesses harness the power of BI reporting by offering end-to-end solutions.
Ready to upgrade your business with advanced BI reporting? Contact Folio3 today to explore how we can transform your data into actionable insights and drive smarter decision-making.

