
A game-winning goal, a record-breaking sprint, or a perfectly timed substitution is no longer left to chance. Behind every big moment in sports lies a wealth of data quietly guiding the action. Sports data analytics is where raw numbers meet human performance, helping athletes and coaches make more intelligent decisions based on objective evidence rather than gut feeling.
As data analytics in sports gains ground, teams worldwide are using technology to refine training, reduce injury risks, and boost game-day performance. According to Allied Market Research, the sports analytics market is expected to hit $22 billion by 2031, proving how vital this shift has become.
So, what is sports analytics, and why does it matter? Sports analytics uses data collection, statistical models, and performance tracking tools to evaluate and improve athletic performance, team strategies, and business decisions in the sports industry.
From GPS wearables tracking player movements to video analysis breaking down in-game decisions, data analytics is key in optimizing training sessions, preventing injuries, and refining game tactics for sports teams. This article will explore how data is used in sports, the technologies involved, real sports analytics examples, and the measurable impact on KPIs and performance metrics, providing a complete overview of data analysis in sports today.
What is Sports Analytics?
Sports analytics is collecting, analyzing, and interpreting data to support decision-making in sports. It combines statistics, technology, and performance metrics to give teams, coaches, and players actionable insights. Whether it’s tracking a basketball player’s shooting accuracy, a football team’s passing patterns, or a runner’s endurance levels, data analytics in sports transforms raw data into meaningful strategies.
The goal? To improve individual and team performance, reduce injuries, and make smarter tactical choices on and off the field. Today, staying updated on the latest data analytics trends is essential, as big data sports analytics is used in scouting, game preparation, player development, and even fan engagement—proving it’s not just a trend but a competitive necessity in modern sports.
Performance Metrics and KPIs in Sports
In competitive sports, intuition alone no longer cuts it. Coaches, analysts, and athletes increasingly turn to sports data analytics to make informed decisions that drive performance. This is where performance metrics and key performance indicators (KPIs) come into play—they provide measurable insights into how well a player or team is performing and where improvements are needed.
Let’s look at how different sports use these data points effectively:
1. Football/Soccer
In football, analytics go beyond goals scored. Metrics like:
- Passing Accuracy reflects a player’s precision and decision-making under pressure. Midfielders, for instance, are often evaluated by their ability to maintain possession and transition play.
- Expected Goals (xG) have transformed how we evaluate scoring chances. Rather than just counting goals, xG assigns a probability to each shot based on location, angle, and type of assist, offering a more realistic measure of a striker’s performance.
- The distance covered is used to assess player work rate and stamina. Analytics teams track this to monitor fatigue, especially for players in high-pressure or box-to-box roles.
2. Basketball
Basketball relies heavily on real-time stats, and data analytics in sports has been deeply integrated into how teams draft, train, and substitute players.
- Player Efficiency Rating (PER) is a composite stat that summarizes a player’s overall impact per minute. It factors in points, rebounds, assists, steals, and blocks, offering a balanced performance snapshot.
- The Usage Rate shows how involved a player is in the team’s offensive plays. A high usage rate can be a sign of a star player or overreliance.
- Plus/Minus (+/-) is a simple yet powerful metric that shows how the team performs when a specific player is on the court. It captures the intangible impact beyond individual stats.
3. Cricket
Cricket analytics have grown rapidly with the rise of T20 and franchise leagues, and big data sports analytics is helping teams tailor strategies ball by ball.
- Strike Rate shows how quickly a batsman scores—critical in limited-over formats where quick runs are essential.
- Bowling Economy measures how many runs a bowler concedes per over. Economic bowlers are often more valuable in T20, where run control is key.
- Win Shares, although less common in traditional scorecards, estimate how much a player contributes to the team’s success using a range of batting, bowling, and fielding data.
4. Tennis
In tennis, every point counts—and sports performance analysis breaks the game down to micro-moments:
- First-Serve Percentage highlights a player’s ability to land serves in play, which can set the tone for the rest of the rally.
- Unforced Errors give insight into mental sharpness and consistency. High error counts often correlate with match losses, especially at key moments.
- Break Point Conversion shows how well a player capitalizes on their chances to take control of a set. It’s a vital stat for understanding pressure performance.
Why These Metrics Matter?
These KPIs help teams and athletes shift from guesswork to data-backed strategies. These metrics are the essence of data analytics for sports teams: turning numbers into a competitive edge. Many data analytics companies provide the tools and expertise to monitor and analyze this performance data regularly, enabling organizations to:
- Optimize training programs.
- Predict injury risks.
- Tailor strategies to the opponent’s weaknesses.
- Improve recruitment and player development.
Application of Sports Analytics
The impact of sports data analytics extends far beyond the scoreboard. From the training ground to the boardroom, data is shaping how sports teams operate, make decisions, and connect with fans. These sports analytics examples demonstrate how deeply embedded data has become in modern sports, with many organizations now leveraging specialized data analytics services to gain a competitive edge.
Whether it’s refining a player’s skillset or enhancing the fan experience, analytics helps teams act smarter, faster, and more effectively. Let’s take a closer look at the core areas where data analytics in sports is actively transforming outcomes:
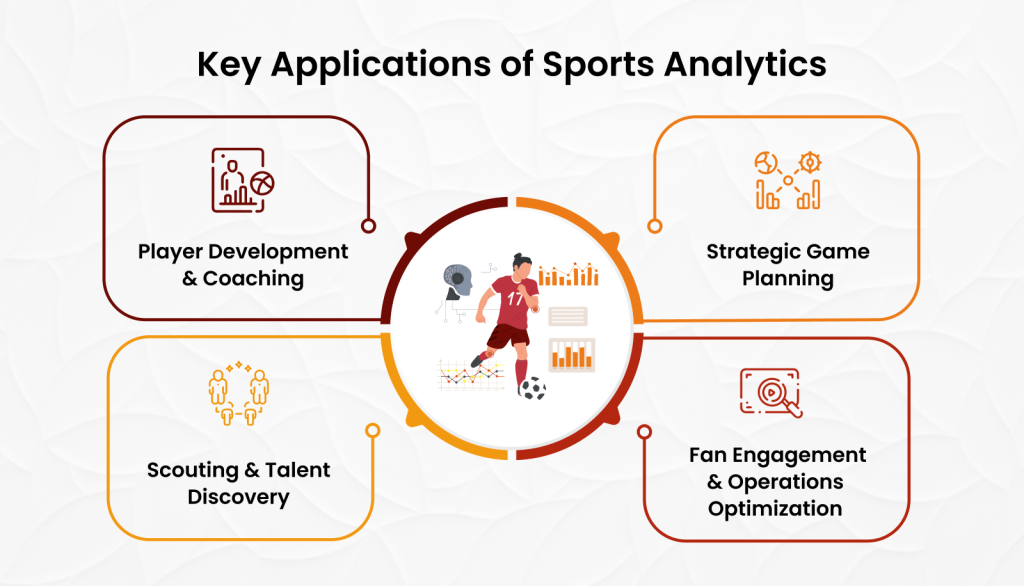
1. Player Development and Coaching
One of the most valuable uses of data analytics for sports teams is individual player development. By analyzing training loads, recovery times, heart rates, and movement patterns, coaches can tailor training sessions to each athlete’s needs.
For instance, Premier League teams like Manchester City and Arsenal use GPS trackers and performance monitoring tools to reduce injury risks and improve on-field efficiency. A study published in the British Journal of Sports Medicine discusses the use of the acute:chronic workload ratio (ACWR) as a method to manage training load and reduce injury risk
Coaches also rely on sports performance analysis to correct technical flaws—whether it’s refining a tennis player’s serve mechanics or improving a basketball player’s shooting form.
2. Team Strategy and Tactical Planning
Understanding the opponent and crafting a game plan accordingly has become more precise with data analysis in sports. Analysts break down video footage and match data to find patterns—such as how often a football team switches formation mid-game or which zones a basketball team exploits most frequently.
Take the NFL for example. Teams now use predictive analytics to simulate play outcomes based on historical data. In the 2022 season, Next Gen Stats showed that teams using real-time data were 12% more likely to make successful 4th-down conversions compared to those relying on instinct alone.
This level of strategic planning gives teams a measurable edge, turning analysis into action.
3. Scouting and Talent Identification
Scouting is no longer based solely on intuition or a handful of standout plays. With big data & predictive analytics, clubs and franchises can assess thousands of players using consistent metrics.
Platforms like Wyscout and Instat allow scouts to evaluate players across leagues based on performance trends, physical stats, and mental attributes. For example, a young striker’s xG (expected goals), sprint count, and shot placement accuracy can be reviewed over an entire season—giving scouts a clearer picture of potential rather than isolated highlights.
This approach not only reduces recruitment risks but also opens doors to hidden talent overlooked by traditional scouting.
4. Fan Engagement and Business Operations
Beyond the field, sports data analytics plays a key role in business strategy. Teams now analyze fan behavior—ticket purchases, merchandise trends, and social media interactions—to personalize campaigns and improve engagement. Many organizations are also turning to data strategy consulting services to develop structured approaches for managing and leveraging this data effectively.
Major League Baseball teams are using real-time attendance and concession data to optimize staffing and logistics on game day. Data also supports revenue forecasting, sponsorship decisions, and venue planning, showing how data analytics in sports powers both performance and profit.
Injury Prevention and Analytics
In high-performance sports, avoiding injury can be just as critical as scoring goals or breaking records. That’s where sports data analytics plays a powerful role—helping teams monitor physical strain, forecast potential breakdowns, and make informed decisions to keep athletes healthy.
By combining big data sports analytics with day-to-day training insights, teams now have a smarter way to manage athlete wellness. It’s not just about playing harder—it’s about playing longer and staying on the field when it matters most.
Monitoring Workload and Fatigue
Fatigue is one of the most common precursors to injury. By using data analytics in sports, coaches and sports scientists now track detailed workload metrics—like distance covered, sprint intensity, and heart rate variability—to get a real-time view of how hard a player’s body is working.
Take the example of elite football clubs that use wearable GPS devices and motion sensors to gather data during training sessions. These tools allow staff to identify when a player is hitting their physical threshold and needs rest. The UEFA Elite Club Injury Study highlights that overuse injuries, such as hamstring strains, are often linked to excessive player load and fatigue. The study found that 12% of hamstring injuries were attributed to overuse, emphasizing the need for effective load management strategies
Predictive Modeling for Injury Risk
Beyond tracking effort, data analysis in sports also enables prediction. By feeding historical performance, injury records, and biometric data into machine learning models, teams can forecast an athlete’s injury risk before symptoms appear. Many teams are now leveraging advanced predictive analytics solutions to enhance the accuracy and timeliness of these forecasts.
This predictive approach has been adopted across leagues—from the NBA to the English Premier League. For instance, some teams use analytics to flag when a player shows early signs of muscular fatigue or asymmetric movement, which often precedes strains or ligament issues. This allows coaches to intervene with recovery strategies or workload adjustments before it’s too late.
Such examples highlight how data analytics for sports teams is evolving from descriptive to proactive—turning sports performance analysis into a protective shield as much as a performance enhancer.
Success Stories in Sports Data Analytics
Real-world examples help demonstrate how sports data analytics delivers tangible value. From performance insights to operational efficiency, organizations across the industry are leveraging data to make smarter, faster decisions.
Case Study- Ludex – Scalable AI for Sports Card Valuation
Ludex is a mobile app that allows users to scan, identify, and assess the value of sports and trading cards. Using a blend of AI, machine learning, and data analytics in sports, Ludex provides collectors with real-time valuations and historical trends. To meet the demands of a growing user base and high-volume card scans, Ludex partnered with Folio3, a leading sports analytics company, to build a modern, scalable data infrastructure.
The Challenge – Managing High-Volume Sports Data in Real Time
These challenges reflect a common theme in big data sports analytics—the need to process and act on data rapidly, without compromising accuracy. As user activity grew, Ludex faced several key challenges:
- Massive data volumes: Thousands of sports cards were scanned daily, each requiring identification and valuation.
- Manual workflows: Card classification and value attribution were time-consuming and error-prone.
- Demand for instant results: Collectors wanted real-time price estimates and trend analysis.
- Scaling with growth: As more users joined and new cards were introduced, Ludex needed a future-proof, scalable solution.
The Solution – End-to-End MLOps and Cloud-Based Automation
Folio3 implemented a cloud-native architecture that integrated machine learning and data analytics for sports teams into Ludex’s core platform. Key components included:
- AI-Powered Card Recognition: ML models trained to extract attributes like player name, team, year, and rarity from scanned images.
- ETL Pipelines with AWS Glue: Automated transformation and processing of card data for rapid ingestion into the warehouse.
Real-Time Valuations with Amazon SageMaker: Instant inference from trained models allowed users to get card values in seconds. - CI/CD & MLOps Integration: Model training, testing, and deployment were automated through pipelines using AWS Lambda, Docker, and Kubernetes.
- Data Warehousing with Snowflake: Ensured clean, query-ready data to support analytics dashboards for both end-users and internal teams.
Results – A Scalable, Insight-Driven Platform
With Folio3’s help, Ludex redefined how data analytics in sports can improve business efficiency and user engagement:
- 80% reduction in manual effort – Automated ingestion saved over 5 hours of daily manual work.
- 50% faster data processing – Rapid batch ETL enabled real-time valuation and trend reporting.
- 3x scalability – The platform handled growth effortlessly, with room to expand further.
- Improved accuracy and UX – Data-driven predictions improved card recognition and valuation precision.
Why It Matters?
While Ludex isn’t a sports team, its success highlights how data analytics for sports teams and related businesses can deliver measurable improvements. Whether it’s recognizing a rare card or predicting player fatigue, data analysis in sports is all about using information wisely and at scale.
Tools and Technologies in Sports Analytics
The power of sports analytics lies not only in the insights it delivers but also in the tools that enable those insights. From video analysis platforms to predictive modeling engines, technology plays a pivotal role in transforming raw data into strategic decisions. Increasingly, teams are exploring generative AI for data analytics to create more nuanced models, simulate game scenarios, and generate actionable insights that were previously impossible to obtain.
Together, these technologies empower coaches, trainers, and athletes to make informed decisions grounded in real-time, data-driven insights. As more sports embrace digital transformation, these tools will only become more essential in achieving peak performance.
Leading Platforms Powering Sports Analytics
Several specialized platforms have emerged as industry leaders in the sports analytics ecosystem. These tools are used by top professional teams, amateur leagues, and training academies worldwide:
- Hudl: A video and performance analysis tool widely used by coaches and athletes to review gameplay footage, assess tactics, and scout opponents. Hudl allows tagging of key plays, real-time performance feedback, and streamlined communication between coaching staff and players.
- Catapult: Known for its wearable GPS trackers and motion sensors, Catapult helps monitor athlete performance metrics like distance covered, acceleration, and workload. It’s especially valuable for injury prevention and conditioning programs.
- STATS (now Stats Perform): A robust analytics engine that combines AI with deep sports data to deliver insights on player performance, game predictions, and fan engagement strategies. It’s heavily used in soccer, basketball, and American football.
- SAP Sports One: A cloud-based platform designed for holistic team management. SAP Sports One integrates player fitness tracking, game data, tactical planning, and medical records into one system—ideal for team performance optimization and long-term strategic planning.
Machine Learning and AI in Predictive Analytics
Machine learning and artificial intelligence (AI) are redefining what’s possible in sports data analytics. These technologies are used to:
- Predict player injuries by analyzing biomechanical patterns, workload, and fatigue markers.
- Forecast game outcomes by evaluating historical performance, player statistics, and opponent tendencies.
- Optimize recruitment using predictive modeling to identify high-potential athletes from youth or lower leagues.
- Personalize training regimens by detecting areas of improvement or overtraining risk through pattern recognition.
IoT Devices, Wearables, and Smart Tracking Systems
The rise of the Internet of Things (IoT) in sports has opened up new avenues for data collection and performance monitoring:
- Wearable sensors: Devices like GPS vests, heart rate monitors, and EMG sensors track biometric data and movement during practice and competition.
- Smart equipment: Basketballs, soccer balls, and tennis rackets embedded with sensors can measure speed, spin, impact location, and more.
- Environmental sensors: Track temperature, humidity, or field conditions to help prevent injuries and optimize performance.
- Real-time telemetry: Coaches can access live performance feeds during games, enabling immediate tactical adjustments or substitution decisions.
Conclusion
Sports data analytics is no longer a luxury it’s a necessity in today’s high-performance sports environment. From improving player development to preventing injuries and optimizing team strategy, data analytics in sports empowers organizations to make smarter, faster, and more accurate decisions. As the demand for advanced analytics and real-time insights grows, having the right data infrastructure becomes critical.If you’re looking to unlock the full potential of sports performance analysis with cutting-edge data solutions, Folio3 Data Services is your trusted partner. With proven success in delivering scalable, AI-driven analytics platforms, we help sports organizations turn raw data into winning strategies.