

Snowflake has earned a strong reputation as a cloud-native data platform, offering elastic compute, near-infinite storage, and simplified data sharing. But while its pay-per-use model brings flexibility, it can also introduce unexpected costs and performance lags if not managed properly.
According to reports, intelligent orchestration, auto-scaling, and query tuning can deliver performance improvements of up to 50% and cost savings of 30–50%. If you’re noticing sluggish queries, excessive credit consumption, or slow dashboard load times, these are signs your Snowflake environment needs tuning.
Performance optimization in Snowflake isn’t just about speed, it directly impacts your monthly bill and the experience of every data user in your team. This blog breaks down the core reasons behind suboptimal performance and introduces practical techniques for optimizing Snowflake performance.
Understanding Snowflake’s Architecture
Before diving into performance optimization in Snowflake, it’s important to understand how its architecture works—and why it behaves differently from traditional databases.
At its core, Snowflake uses a decoupled compute and storage model. This means your data is stored independently of the computing resources used to process it. Storage is handled in a centralized repository on the cloud (typically AWS, Azure, or Google Cloud), while compute is managed by scalable units called Virtual Warehouses. This separation allows Snowflake to scale compute resources up or down without affecting stored data, making it ideal for variable workloads.
Key Components Impacting Performance
Three key components directly affect Snowflake’s performance and showcase some of the most powerful Snowflake features:
- Virtual Warehouses: These perform all query processing. The size and number of warehouses directly influence query speed and concurrency.
- Query Optimizer: Snowflake has a cost-based optimizer that determines the most efficient execution path for each query.
- Caching Layers: Snowflake automatically caches query results, metadata, and data at multiple levels to reduce redundant processing.
Why Does Tuning Snowflake Differ From Traditional Databases?
Unlike traditional databases that require manual resource provisioning and often run on fixed hardware, Snowflake handles much of this automatically.
However, tuning in Snowflake involves understanding how credits are consumed and how features like auto-suspend, result caching, and warehouse sizing influence both speed and cost. Optimizing performance here requires a different approach, one that combines query logic with the intelligent use of compute resources.
Key Factors Affecting Snowflake Performance
Performance optimization in Snowflake isn’t just about speeding up queries, it’s also about understanding how your choices affect compute usage and, ultimately, your monthly bill. Recognizing these variables is the first step toward effective Snowflake query performance optimization. Each one influences cost, speed, and overall platform efficiency in its own way. The good news? Most of them are controllable with a few strategic adjustments.
However, several key factors influence how efficiently Snowflake processes data:
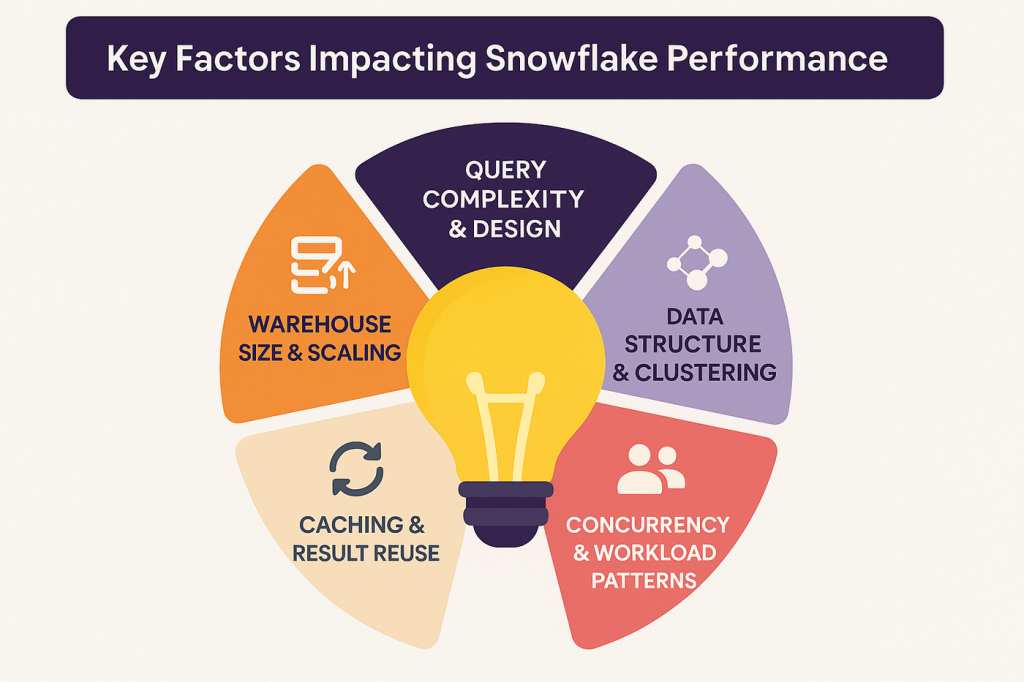
1. Warehouse Size and Scaling Behavior
The Snowflake data warehouse uses compute resources grouped into Virtual Warehouses, with sizes ranging from XS to 6XL. These play a critical role in query performance. Larger warehouses can process data faster but consume more credits. Auto-scaling and multi-cluster configurations help handle demand spikes, but if not properly configured, they can lead to over-provisioning and increased costs.
2. Query Design and Complexity
Inefficient SQL logic—like missing filters, suboptimal joins, or unnecessary nested queries—can slow performance. Even well-sized warehouses won’t compensate for poorly written queries. Leveraging tools like Query Profile or working with experienced Snowflake consulting partners can help identify and fix bottlenecks in your query execution plan.
3. Data Structure and Clustering
How your data is organized impacts scan times. Without proper clustering, Snowflake may have to scan large amounts of data to return results. While automatic clustering exists, it’s not always enough for large, complex datasets. Manually defined clustering keys can help reduce scan size and improve response time.
4. Concurrency and Workload Patterns
Running multiple queries at the same time? High-concurrency workloads can compete for resources, especially on smaller warehouses. Understanding usage patterns and separating workloads across different warehouses can prevent slowdowns during peak usage. Additionally, using Snowflake connectors efficiently—whether for ETL tools, BI platforms, or third-party apps—can help balance data flow and reduce unnecessary strain on compute resources.
5. Use of Caching and Result Reuse
Snowflake caches query results, metadata, and data at multiple levels. Repeated queries—especially those with unchanged results can return almost instantly thanks to result caching. However, changes in underlying data or session settings can invalidate this benefit. Knowing when and how caching works can help reduce unnecessary computation.
Snowflake Query Optimization Best Practices
Even with the right warehouse size and data structure, poor query design can drag down Snowflake’s performance and drive up costs. These Snowflake query optimization strategies are easy to apply and can yield immediate improvements. More importantly, they promote long-term efficiency in Snowflake by aligning query logic with the platform’s underlying architecture.
By adopting a few practical habits, you can write faster, more efficient SQL that makes the most of your Snowflake environment. Here are some best practices to follow:
1. Use EXPLAIN and Query PROFILE
Before you try to optimize a slow query, inspect how it’s being processed. Snowflake’s EXPLAIN command shows the logical execution plan, while Query Profile provides a visual breakdown of what’s happening behind the scenes—step by step. It helps pinpoint which parts of the query are using the most resources, revealing bottlenecks like large scans or slow joins.
2. Avoid
Fetching every column, especially from wide tables, increases unnecessary data transfer and slows things down. Instead, select only the fields you actually need. This reduces the amount of data Snowflake has to scan and move between stages.
3. Use Proper Filtering and Predicate Pushdown
Filtering early helps reduce the dataset size before further processing. Make sure filters are applied in a way that allows predicate pushdown, where Snowflake filters the data as close to the storage layer as possible. This significantly reduces the volume of data scanned.
4. Use CTEs (Common Table Expressions) Wisely
CTEs improve query readability, but they aren’t always optimized automatically. In some cases, Snowflake materializes a CTE multiple times instead of reusing it. If you notice performance issues, try converting CTEs to subqueries or temporary tables to compare execution behavior. This approach is particularly useful when working across cloud data platforms like BigQuery and Snowflake, where optimization behaviors can differ subtly but impact performance significantly.
5. Minimize Data Shuffling
Operations like joins and aggregations often require data redistribution, which can slow down queries. To minimize this, try joining on clustered or commonly indexed columns, and avoid unnecessary cross-joins or large fanouts. This is a core principle in Snowflake data engineering, where thoughtful data modeling and efficient query design go hand-in-hand to ensure high performance.
6. Partition Pruning with CLUSTER BY
Large tables benefit from clustering, especially when queries frequently filter by certain columns like date or region. Using the CLUSTER BY clause allows Snowflake to physically group similar data together, which enables partition pruning scanning only relevant slices of the table instead of the entire dataset.
Warehouse Optimization Techniques
Making smart decisions about your compute layer is one of the fastest ways to improve Snowflake performance and control cost. So, choosing the right virtual warehouse setup in Snowflake isn’t just about performance — it’s also one of the biggest drivers of Snowflake cost optimization.
Poorly sized or constantly running warehouses can burn through credits without adding value. With the right policies in place, you’ll avoid over-provisioning and ensure resources are used only when and where they’re needed. The below techniques can help you fine-tune your compute usage for better performance and efficiency.
1. Choose the Right Warehouse Size and Scaling Policy
Start small and scale only when necessary. A Large or X-Large warehouse isn’t always the best choice—especially for small queries or ETL jobs. Snowflake allows you to scale up or out depending on your needs. For unpredictable workloads, auto-scaling multi-cluster warehouses may be worth considering, but they should be carefully managed to avoid unintentional overspend.
2. Use Multi-Cluster Warehouses for High-Concurrency Workloads
If you’re running many simultaneous queries—like powering dashboards or supporting multiple users—multi-cluster warehouses can help maintain performance. They spin up additional clusters automatically to handle traffic spikes, preventing bottlenecks. But keep in mind: each cluster adds to your credit usage. This is particularly valuable for use cases like Snowflake audience management, where high concurrency is common during segmentation or campaign execution.
3. Suspend Idle Warehouses
Snowflake charges for compute by the second. If a warehouse is sitting idle, it’s still costing you money unless auto-suspend is enabled. Set warehouses to automatically suspend after short periods of inactivity (e.g., 60 seconds), and enable auto-resume so operations don’t break when users reconnect.
4. Monitor Warehouse Usage with Resource Monitors
To stay on top of usage, set up Resource Monitors. These help track credit consumption across accounts, warehouses, and time periods. You can define alerts and limits to prevent runaway usage before it turns into a surprise bill. It’s especially useful for teams working on shared data platforms.
Storage and Data Layout Optimization
Even though Snowflake handles most of the heavy lifting behind the scenes, how you store and organize your data still plays a big role in query performance. The way data is loaded, partitioned, and clustered affects how efficiently Snowflake can retrieve it.
By managing how data is loaded, clustered, and stored, you can significantly cut down on scan times and query costs. Snowflake is optimized to handle large-scale data, but thoughtful organization ensures you’re getting the most out of its architecture.
Here are a few proven techniques to optimize storage and layout:
Efficient Data Loading – Use COPY INTO with Proper File Sizes and Formats
When loading data into Snowflake, using the COPY INTO command with well-structured file formats like compressed CSV, Parquet, or Avro helps speed up ingestion. For efficient Snowflake data ingestion, avoid overly large files (over 500 MB) or tiny ones (under 10 MB), as both can cause performance issues. Snowflake recommends loading data in chunks between 100–250 MB for best results.
Use Clustering Keys for Frequently Filtered Columns
If your queries often filter on specific columns like order_date, region, or customer_id defining those columns as clustering keys can help reduce scan time. Clustering helps Snowflake physically group related rows, which means the engine doesn’t have to scan unnecessary micro-partitions during query execution.
Periodically Reclustering Tables as Needed
Over time, even well-clustered tables can become fragmented as new data gets inserted. This can reduce the effectiveness of partition pruning. If you’ve defined clustering keys manually, consider reclustering periodically based on query performance trends or after significant data updates.
Avoid Excessive Micro-Partitions
Snowflake automatically divides tables into micro-partitions (up to 16 MB each), but too many of them especially with small or trickle-loaded data can create overhead. Consolidating data during loads and avoiding overly frequent inserts can help maintain a cleaner, more query-efficient layout.
How Snowflake Uses Caching to Speed Up Queries
One of the reasons Snowflake performs so well out of the box is its intelligent caching system. By reusing previous computations and minimizing data retrieval from storage, caching helps reduce query times and lower compute costs. But to take full advantage, it’s important to understand how caching works and how to make it work for you.
Caching isn’t something you control directly, but understanding how it works allows you to write smarter queries and make better architectural choices. Used wisely, caching can drastically cut down on both wait times and credit consumption.
Understanding the Three Types of Caching
1. Metadata Cache
This stores table definitions, schemas, statistics, and file-level metadata. It’s used to quickly check what data exists and whether anything has changed, helping Snowflake skip unnecessary scanning.
2. Result Cache
If you run the same query (with the same role, warehouse, and data state), Snowflake may serve the results directly from the result cache, without re-executing the query. This can return results in milliseconds—and at zero cost.
3. Data Cache
When a warehouse accesses data, Snowflake temporarily stores it in a local SSD cache. If the same or similar query runs again, it can read from cache instead of going back to long-term storage, improving speed significantly. However, this cache is cleared when the warehouse suspends.
When Are Cached Results Reused?
- The result cache is reused only if the underlying data hasn’t changed and the query is identical.
- The data cache benefits workloads where the warehouse stays active and users run similar queries in a short timeframe.
- The metadata cache is used continuously and automatically to reduce planning overhead — a key advantage for high-traffic Snowflake reporting environments.
Strategies to Maximize Cache Effectiveness
- Enable auto-resume and avoid frequent suspends if your team runs many repeated queries. This keeps the data cache warm.
- Reuse queries (especially for dashboards or reports) instead of making small changes that bypass result caching.
- Structure queries consistently. Even tiny differences (like spacing or capitalization) can prevent result cache reuse.
- Avoid using CURRENT_TIMESTAMP or non-deterministic functions if you want Snowflake to serve results from cache.
Monitoring and Troubleshooting Tools and Tricks For Snowflake Performance
Performance tuning in Snowflake isn’t just about writing better queries—it’s also about knowing where to look when things slow down. Snowflake offers built-in tools that let you monitor query behavior, track credit usage, and investigate performance issues.
For teams managing larger or more complex data pipelines, third-party observability tools can provide even deeper insights. Keeping a close eye on Snowflake performance helps catch small inefficiencies before they snowball into major costs or user complaints.
The following tricks and tools make it easier to spot trends, enforce best practices, and stay in control of your data operations:
Track Query Behavior with Query History and Query Profile
Snowflake’s Query History tab gives a detailed view of every executed query—who ran it, how long it took, and how many resources it used. For deeper inspection, the Query Profile tool visualizes the query execution plan step by step. It’s especially helpful for spotting bottlenecks like large joins, inefficient filters, or excessive data shuffling.
Accelerate Complex Workloads with Query Acceleration Service (QAS)
The Query Acceleration Service helps speed up long-running queries by offloading parts of the workload to additional compute resources. It’s useful for large aggregations and complex joins but does come with added cost. Enabling QAS can be a smart move for time-sensitive queries when speed matters more than budget.
Stay in Control with Resource Monitors and Account Usage Views
Resource Monitors allow admins to set credit consumption limits on individual warehouses or across the entire account, helping prevent cost overruns. When combined with Account Usage views — which track warehouse activity, query volumes, and user behavior — these tools provide essential visibility, especially for organizations handling large-scale Snowflake data integration across multiple sources and teams.
Go Beyond the Basics with Third-Party Monitoring Tools
If you need broader observability or integration with existing DevOps workflows, tools like Monte Carlo, DataDog, and Sigma Computing can help. These platforms offer alerting, real-time dashboards, anomaly detection, and even automated root-cause analysis especially helpful in enterprise environments.
Common Pitfalls and How to Avoid Them?
Even with Snowflake’s architecture designed for high performance and scalability, small missteps can quietly degrade efficiency and drive up costs. Here are a few common pitfalls teams run into — and how to stay clear of them.
Over-Provisioning Warehouses
It’s tempting to spin up large warehouses “just in case,” but bigger isn’t always better. Oversized warehouses consume more credits even if queries don’t require the full power. This can quietly lead to Snowflake performance issues and unnecessary costs, so start small, monitor performance, and scale up only when necessary.
Misusing Auto-Suspend and Auto-Resume
Auto-suspend and resume settings are great for saving costs—but misconfiguring them can backfire. Suspending warehouses too quickly can disrupt workloads and lead to cold starts, while leaving them running during idle periods burns credits unnecessarily. Tune these settings based on actual usage patterns.
Ignoring Query History and Profiles
Snowflake gives you the tools to analyze query behavior in detail, but they’re only useful if you use them. Skipping Query History and Query Profile means missed opportunities to detect bottlenecks, inefficient joins, or unnecessary scans. Engaging Snowflake modernization consulting services can help teams uncover these insights faster, implement best practices, and optimize queries more effectively.
Not Using Clustering Where It Matters
Clustering keys can significantly improve performance for large, frequently queried datasets. If your queries involve filtering on high-cardinality columns, skipping clustering can lead to excessive scanning and slower performance. Use CLUSTER BY selectively, based on actual query patterns.
Conclusion
Optimizing Snowflake performance isn’t about massive overhauls, it’s about making smart, consistent decisions across query design, warehouse configuration, data layout, and monitoring. From using EXPLAIN to analyze slow queries, to right-sizing virtual warehouses and taking full advantage of caching, each step plays a role in cutting costs and improving query speed.
Remember, even small inefficiencies can add up quickly in cloud environments. Keeping an eye on resource usage, leveraging tools like Query Profile, and avoiding common missteps like over-provisioning or skipping clustering keys can have a significant impact.If you’re looking for expert support to fine-tune your Snowflake environment, Folio3 Data Services can help. Our team works with businesses across industries to optimize data pipelines, reduce cloud costs, and unlock real-time analytics potential.